• We are STAs
    • Asha Rountree
    • Haley Ma
    • Kate Shih
    • Kyra Lee
    • Nicholas Peasley
    • Sasha Kenney
    • Shanda Horm
    • Shriya Atreya
    • Tomas Marulanda-Mesa
  • We were STAs
  • STA Presentation
    • STA Presentation 2017
    • STA Presentation 2016
  • Testimonials
  • Resources
  • Home

STA Blog

Editing for Infograph Handbook

January 23, 2020 By Abriella Corker

INFOGRAPHS FOR HANDBOOK

FIBERS SECTION

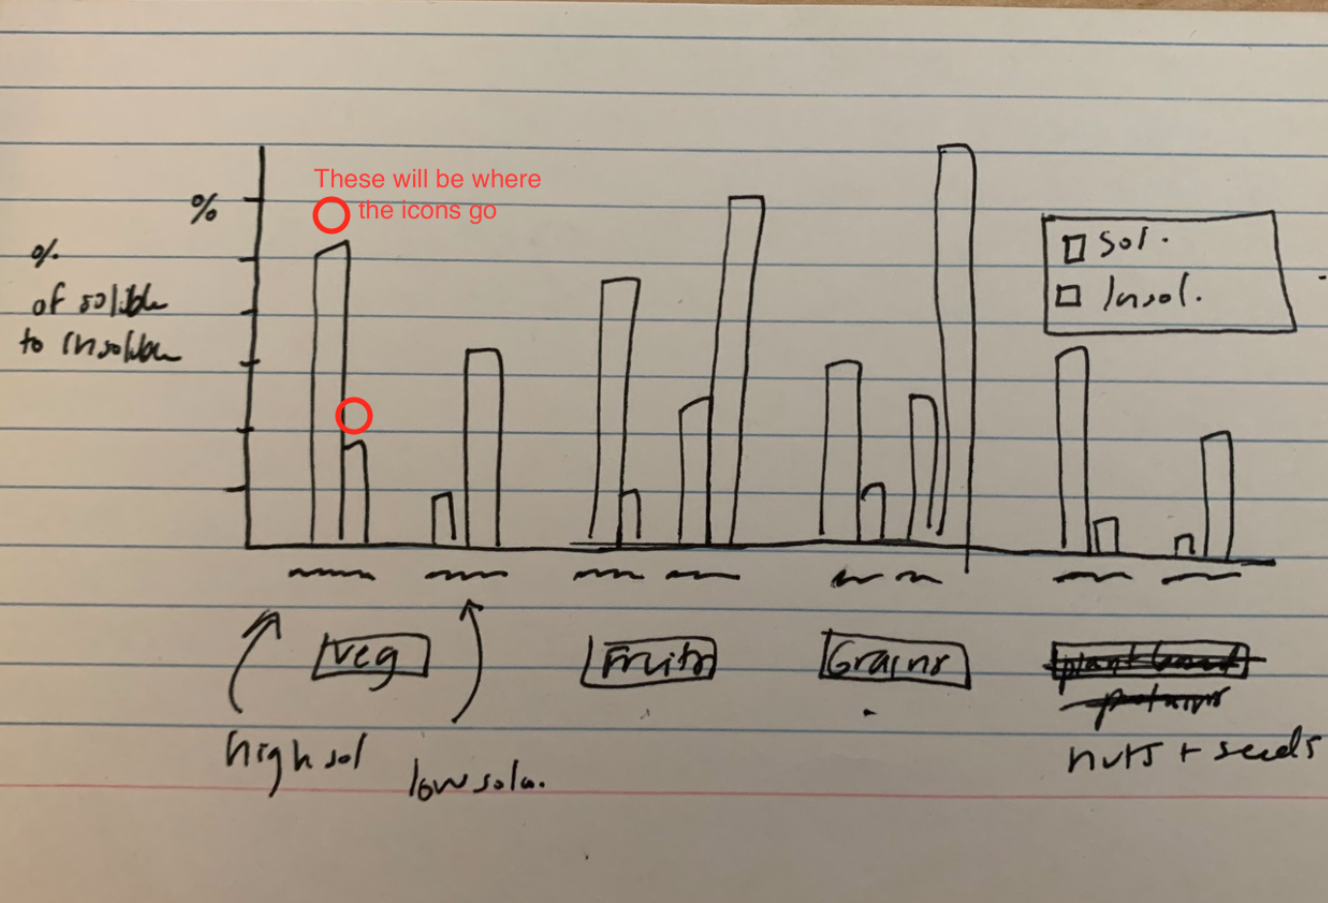
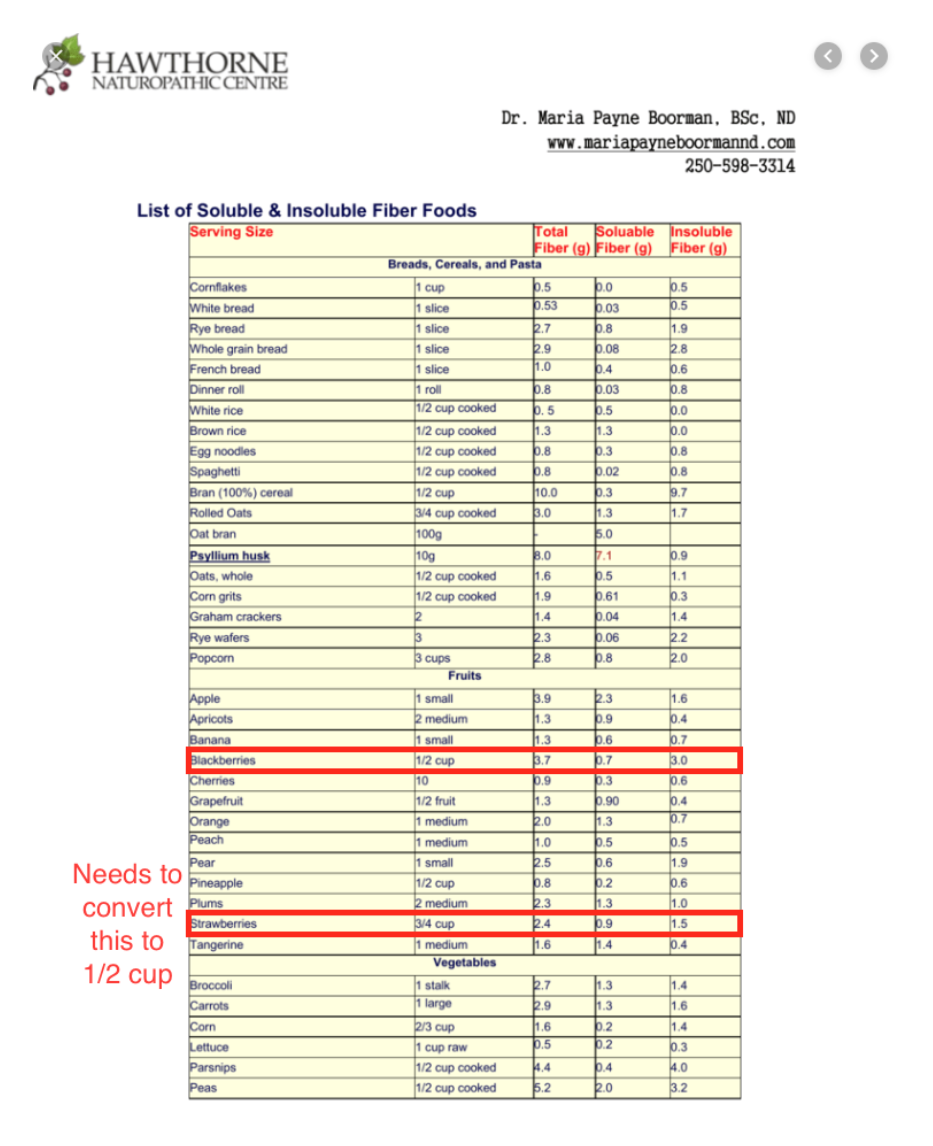
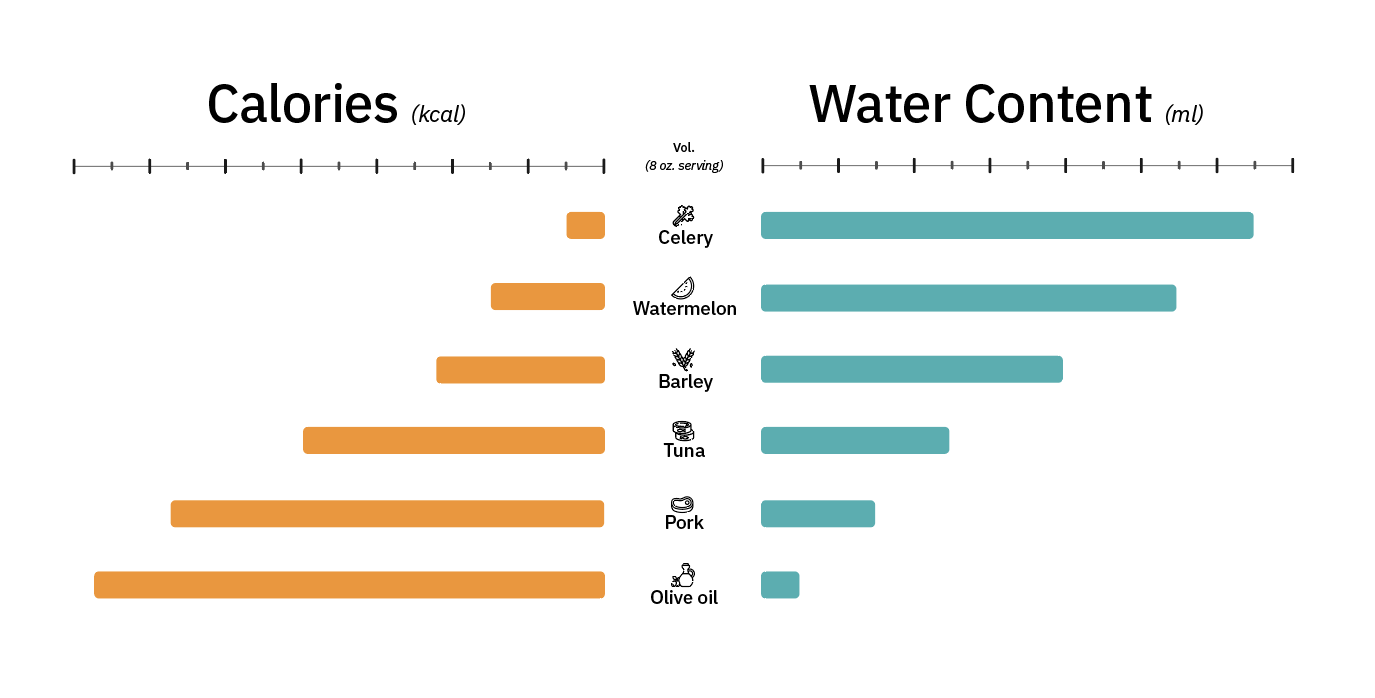
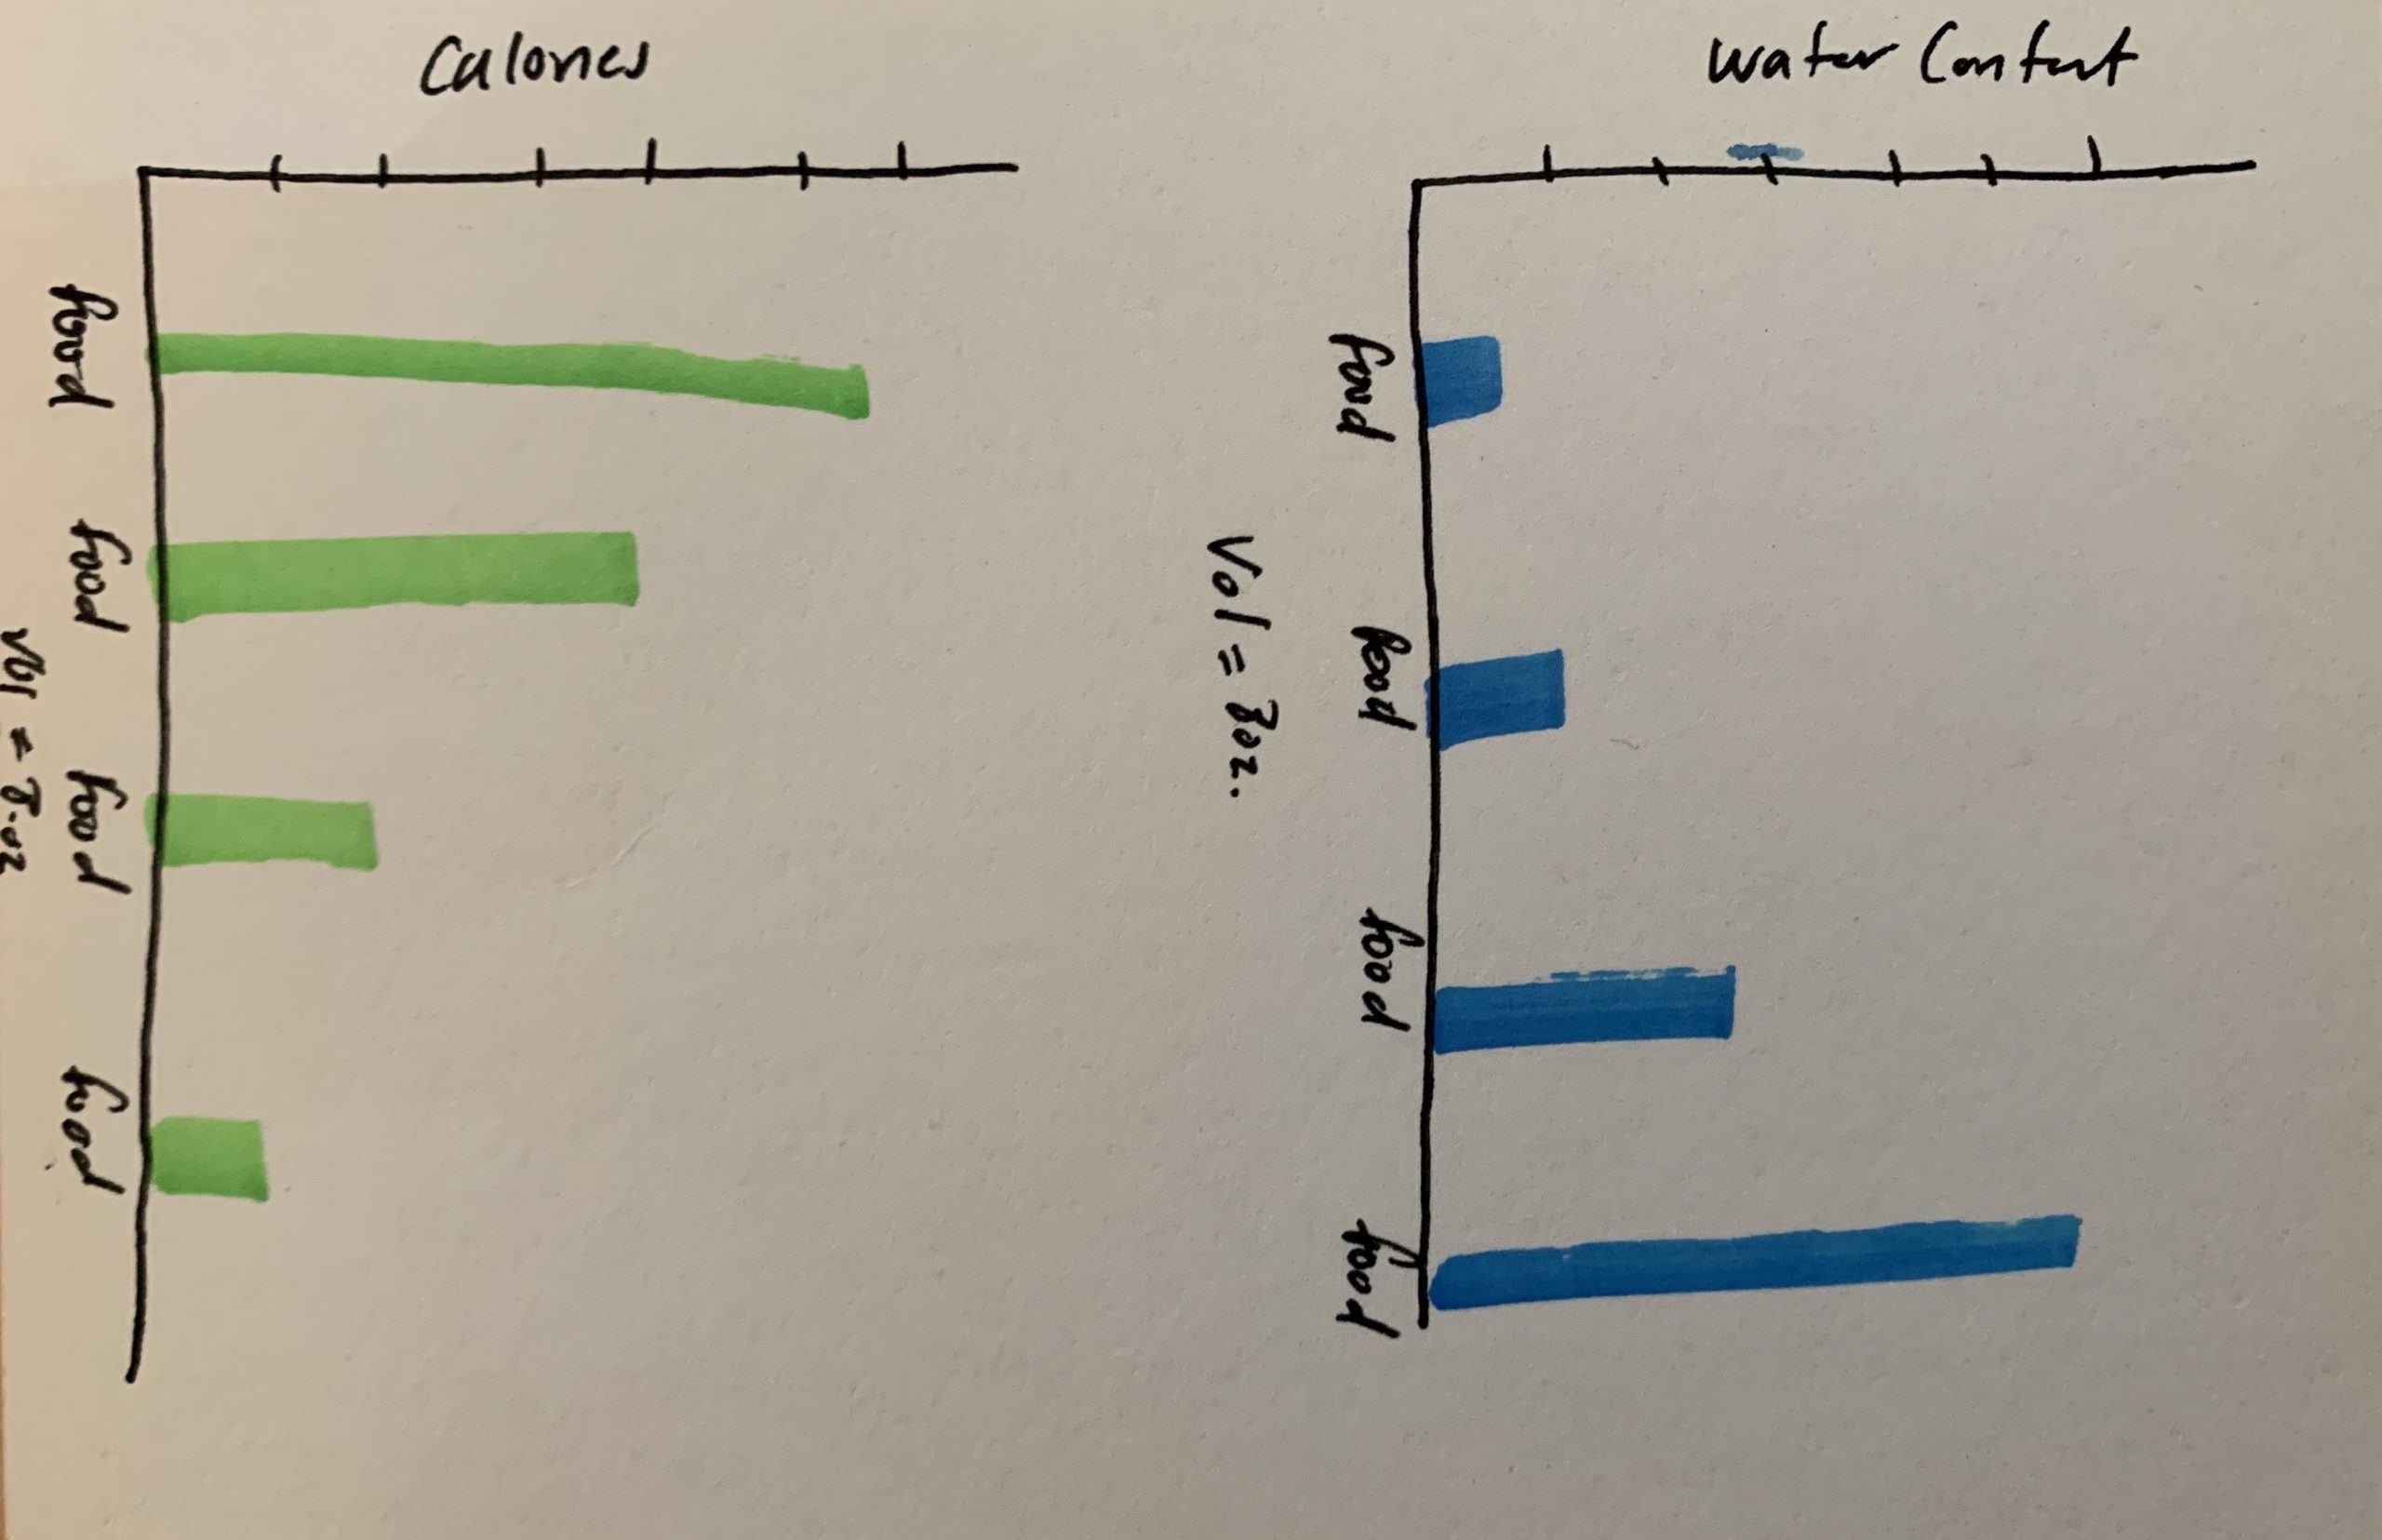
This is the design me and Thuy came up with for the double bar graph comparing the soluble to insoluble foods. On the bottom they are sectioned by a healthy food group (vegetables, fruits, grains, and nuts+seeds). Then above marked as squiggles will be two specific food items in that section. One that is higher in soluble fiber and the other that is higher in insoluble fibers. The units will be in grams based off of what we found when looking up information. We will also include how much per serving size of each specific food item. Maybe all 1/2 a cup serving size. On top of each bar graph, we were thinking of adding some icons of the food itself to make it more lively / artsy.

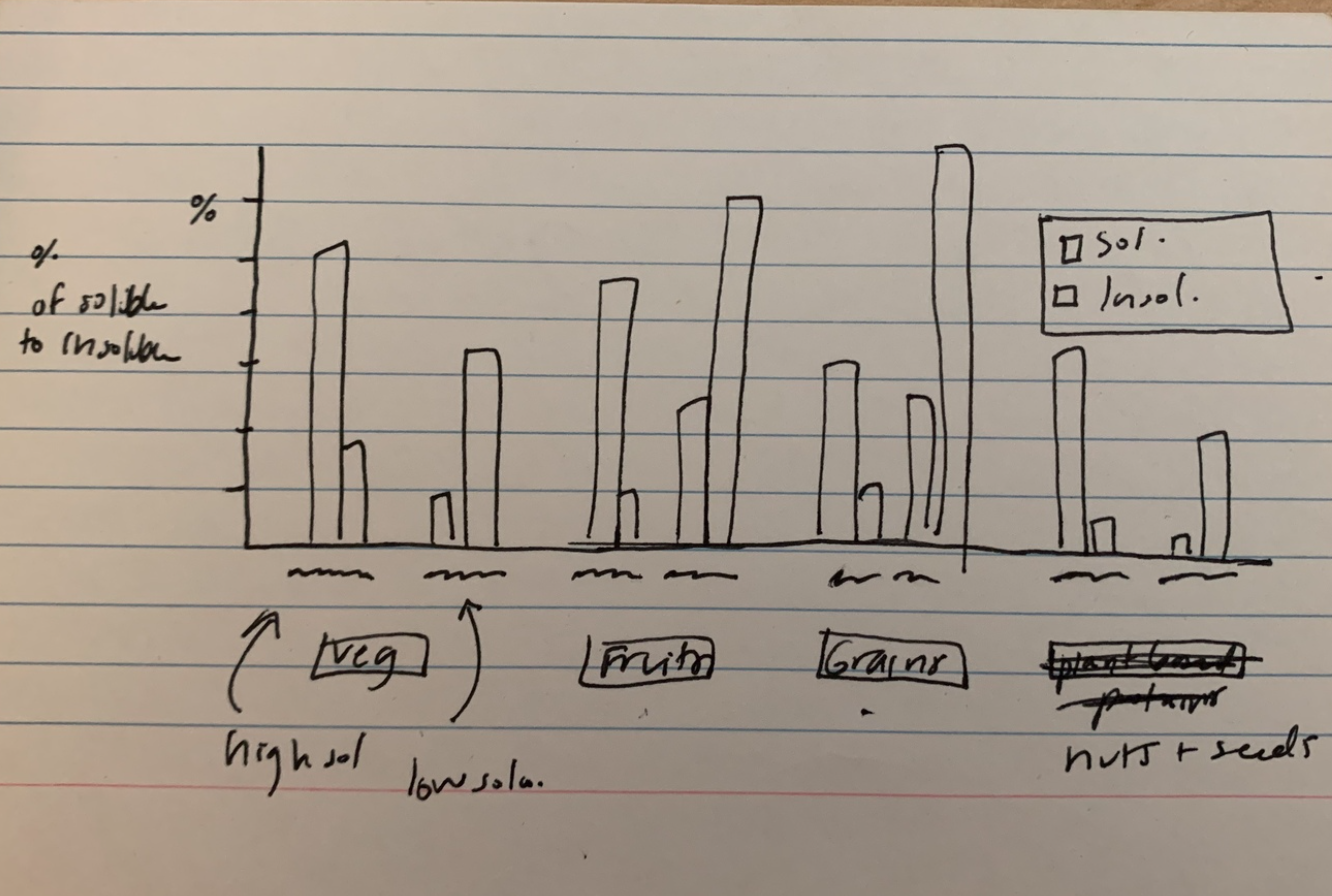
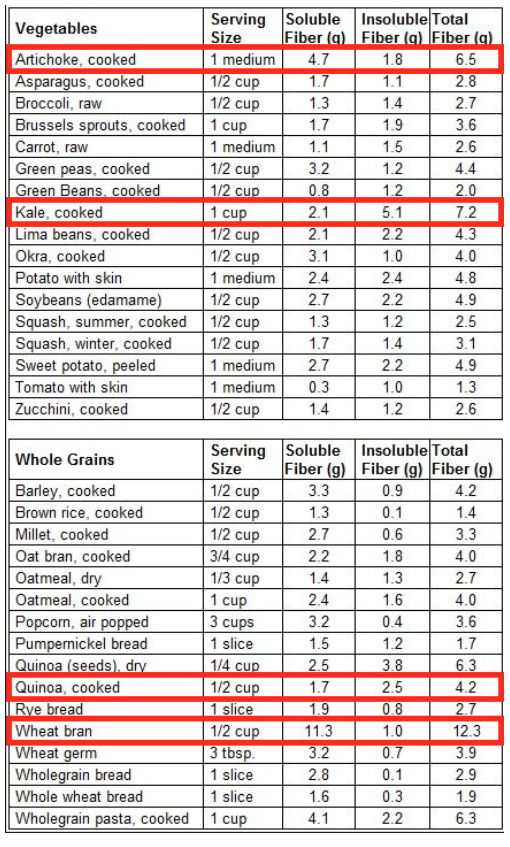
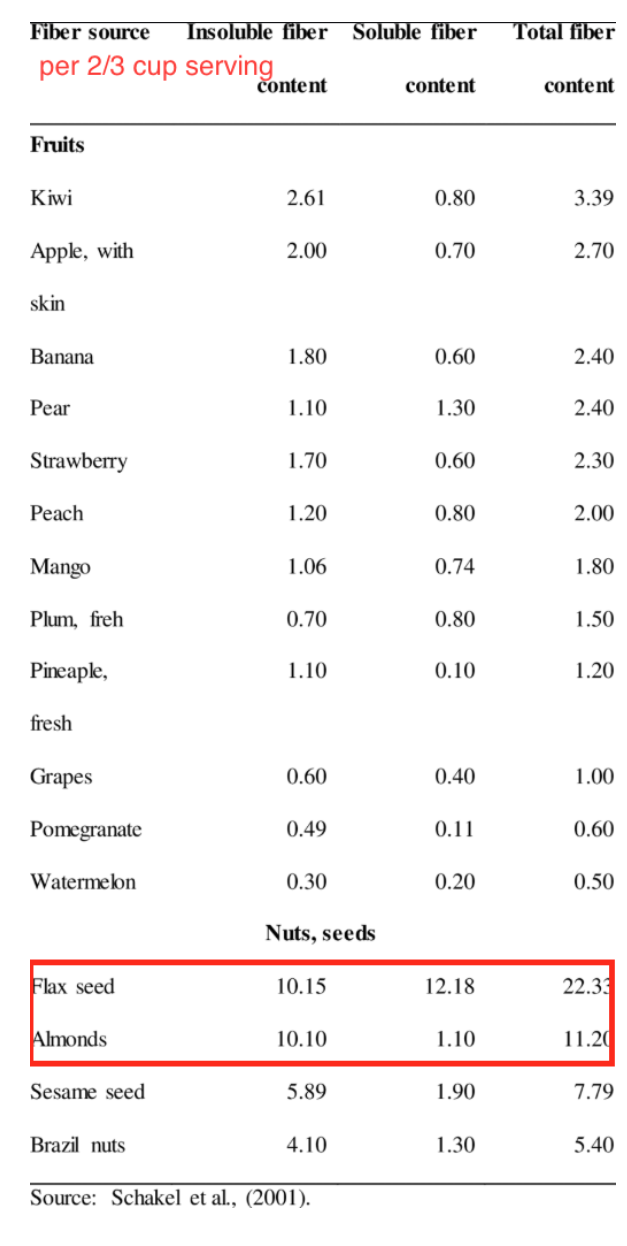
These are some examples of the food we’d like to pair against each other in each group (Vegetables, Grains, Fruits, and Nuts and Seeds). We purposefully chose, in each group, 1 food that is higher in soluble, and 1 that is higher in insoluble.

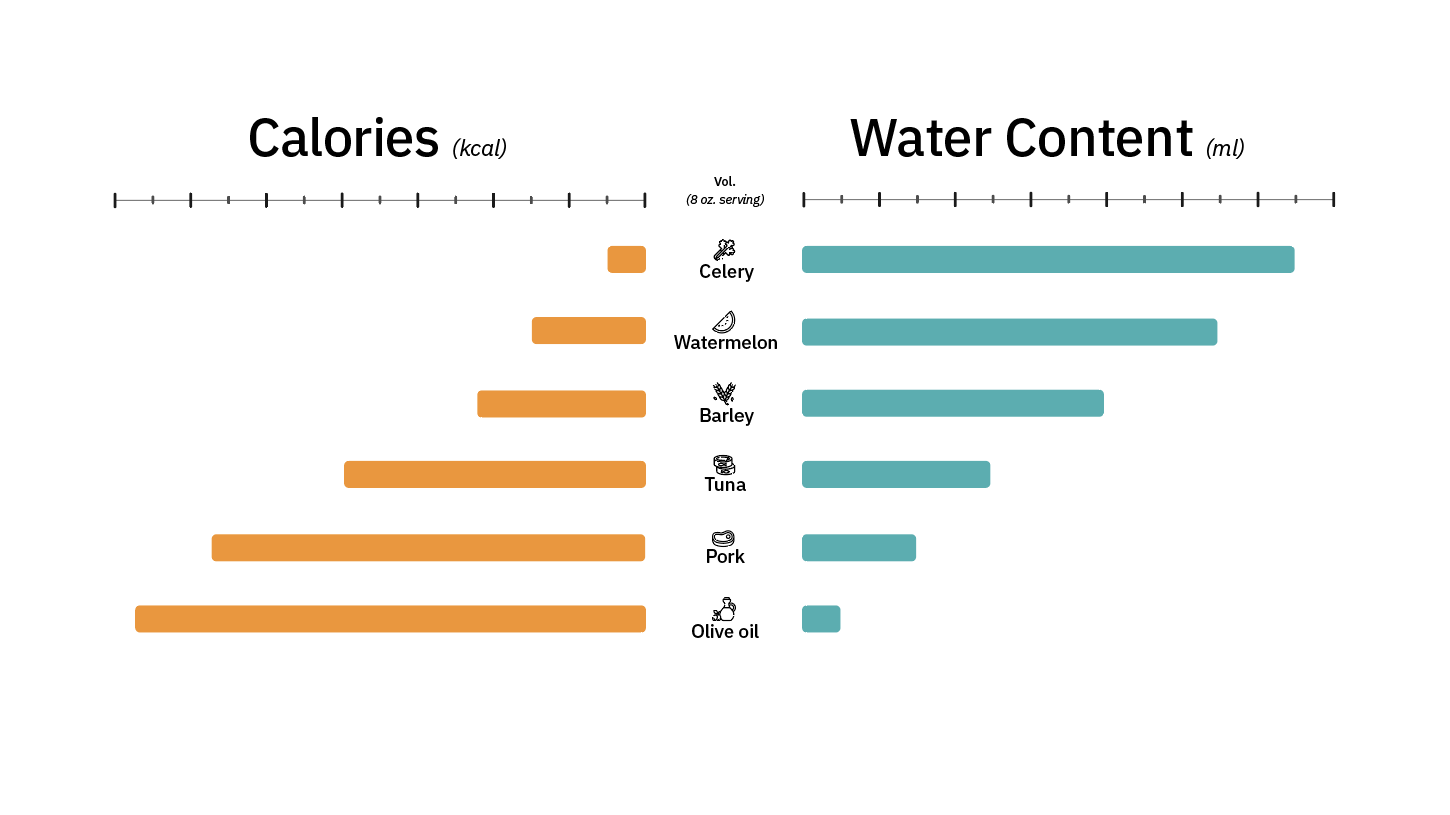
Here is an inspiration image for how we would like the look of the icons to be with the graph.

FATS SECTION

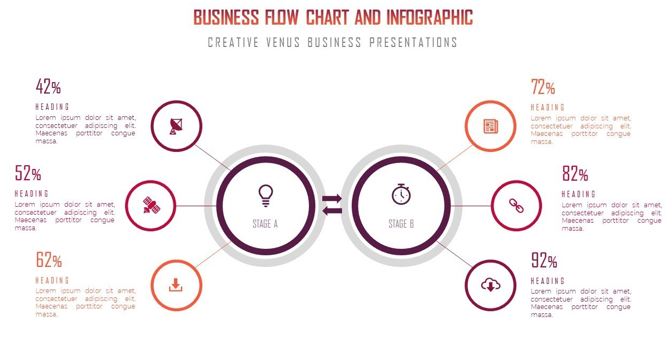
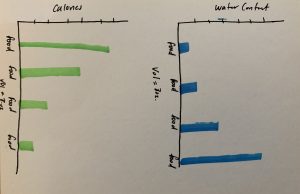
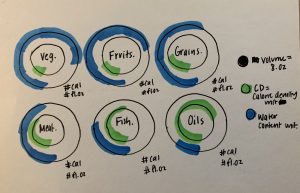
Here is the layout for the fats it will be in a schematic so the types of fatty rich foods shown more clearly. The color will go from light to dark for each tier. The example foods may be actual images in a bubble or an icon as well to match the bar graph icons for the fibers. The organization goes from unsaturated fats to poly and mono unsaturated, then to the types of omegas, then to examples of nutritional sources for these omegas.

Some foods high in Omega-3, 6, and 9.

Omega-3:

  • Tuna
  • Salmon
  • Flaxseed
Omega-6:
  • Pistachios
  • Pumpkin seeds
  • Acai
Omega-9:
  • Olives
  • Avocado
  • Almonds
We were thinking of just having the names and image or illustration / icon of the food in the bubble, as the graph is pretty dense already.


Here are some examples that we liked the styling of that might help inform us as to how we’d like the look of this to be.


COMPLIMENTARY PROTEINS SECTION

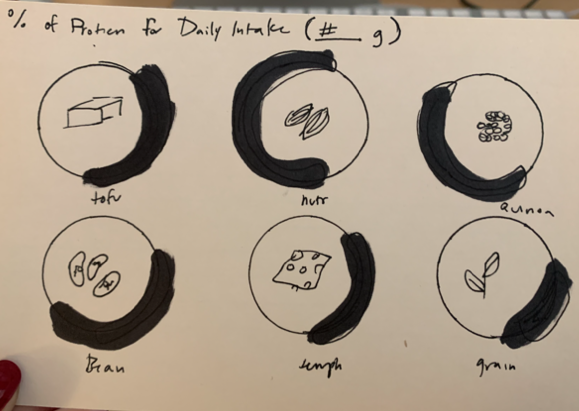
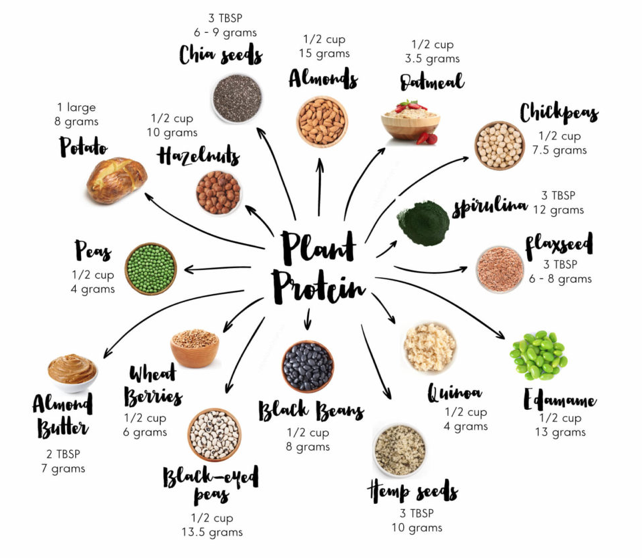
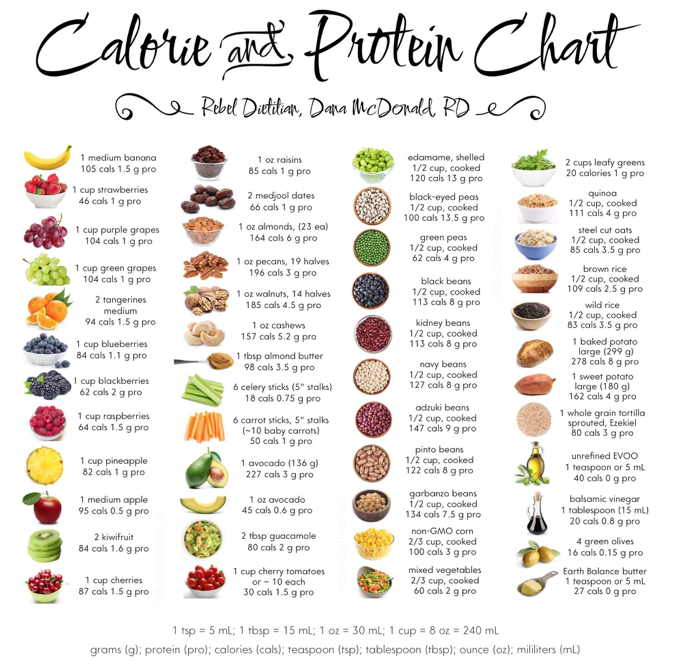
This one will have common meat replacing foods for sources of protein. I have about 6. This darker line will be the percentage of the daily intake out of the 100% daily intake of protein per how ever much the serving size would be. They will have an icon in the center and a name underneath to follow the icon type of the graphs before.

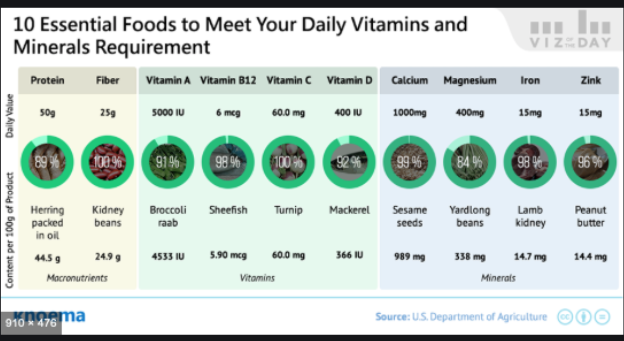
These are some resources we found on protein to help inform how our sketched out design will be laid out.


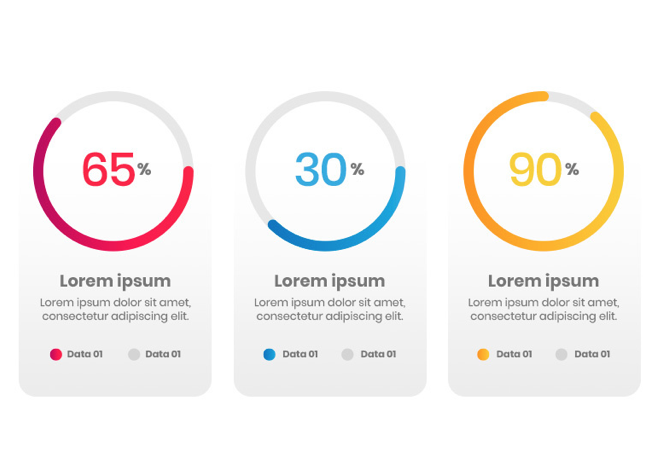
Styling that me and Thuy would like to replicate for this section.

SUPPLEMENTATION  SECTION

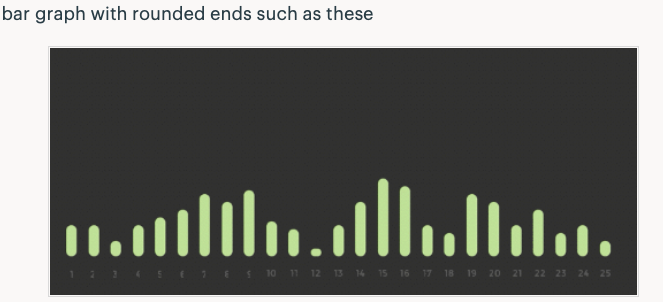
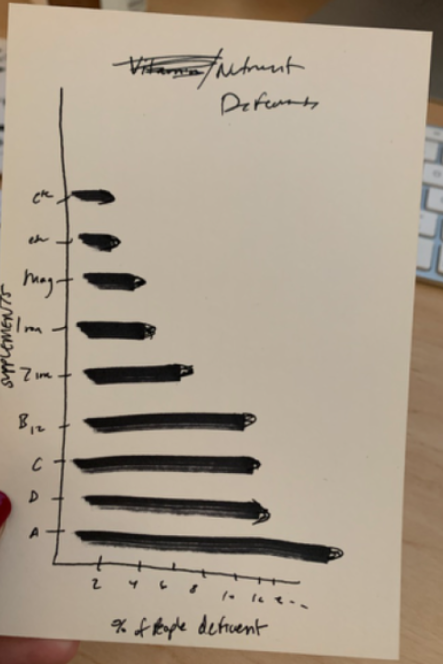
This info graph will show the types of common nutrients on the y-axis and on the x-axis will be the percent of people deficient in that nutrient on average. It will have a rounded end on the bars and will be long and vertical. This section could be developed a little more but it had the least amount of information.

Filed Under: 2019 Fall-Winter | Spring-Summer 2020

Nutrition Education Infographics

January 23, 2020 By Abriella Corker

INFOGRAPHS

Project: Nutrition Education Infographics

Client: Marissa Duswalt Epstein – Lecturer and the Director of The University of Texas Nutrition Institute

Completion status: In progress

Description / plans: Create info graphs to be used in her nutrition handbook. The first assignment is to create an info graph based off of a design brief before starting on graphs for the handbook to establish a sense of style for the overall look in accordance with the styling of the handbook.


These are the rough sketches for the layout of the design brief. It is a comparison chart of calorie density to water content based on a certain volume of a type of food. I drew these out a Thuy then made edits on AI while I helped her make decisions on the type of edits to make within the file.


Here is the first graph that Thuy put together based off of my third sketch above. We are waiting for the client to provide feedback on what she thinks of the design. It is very simplistic to not distract from the information trying to be conveyed through the graph and the text that would be on the handbook. We based the look off of the design guidelines and the appearance of the handbook. Thuy added these icons to make the graph appear more visually appealing and less plain.


Filed Under: 2019 Fall-Winter | Spring-Summer 2020, Uncategorized

CLIOs

January 23, 2020 By Abriella Corker

CLIO EDITING

As you can see I have been completing formatting for huge amount of CLIOs. These edits include adding headers, adding a photo to the banner, formatting text with bullets and proper bolding, as well as adding backgrounds to images with captions. There are still more in my basecamp assigned to me to complete and more to assign myself in the future. Most of these are live now so I will make any edits in the live site.

Filed Under: 2019 Fall-Winter | Spring-Summer 2020

Photo Ids

January 23, 2020 By Abriella Corker

WORKING ON PHOTO IDs

Here are few photo IDs I have been working on since starting classes this week. There was quite a few I had edited during the two weeks before classes started but hadn’t updated the blog about. For updating sake, I have been working on them almost every week. Most go of the editing that needs to be done for these is temperature correcting, exposure, and rotating pictures when the head of the person is too tilted to one side.

Filed Under: 2019 Fall-Winter | Spring-Summer 2020

Nutrition Handbook Draft

January 22, 2020 By Thuy H Nguyen

Nutrition Handbook Draft

Today I worked with Abriella on creating the first draft in Illustrator for the Nutrition Handbook. Here are the two versions that we had so far from the graph that has been approved by the client.

The information in the graphs are arbitrary, since this will be the first drafts that Valerie presents to the client for feedback.

Right now I will be working on the style guide for the infographics so that the guide can be used for future graphs :).

Filed Under: 2019 Fall-Winter | Spring-Summer 2020

Orientation

January 21, 2020 By Ishan Kamat

I went through orientation today. Learned about Basecamp, Workday, and Timesheet. Also learned how to add to this blog. Still need to get on the Slack but that should happen relatively soon I hope.

Filed Under: 2019 Fall-Winter | Spring-Summer 2020

  • « Previous Page
  • 1
  • …
  • 55
  • 56
  • 57
  • 58
  • 59
  • …
  • 80
  • Next Page »

link to LAITS home page

Video STA Home

© 2025 Liberal Arts Instructional Technology Services | Production Credits