Infographic training continue…
I tried to achieve a silkscreen printing style like Suloni suggested:
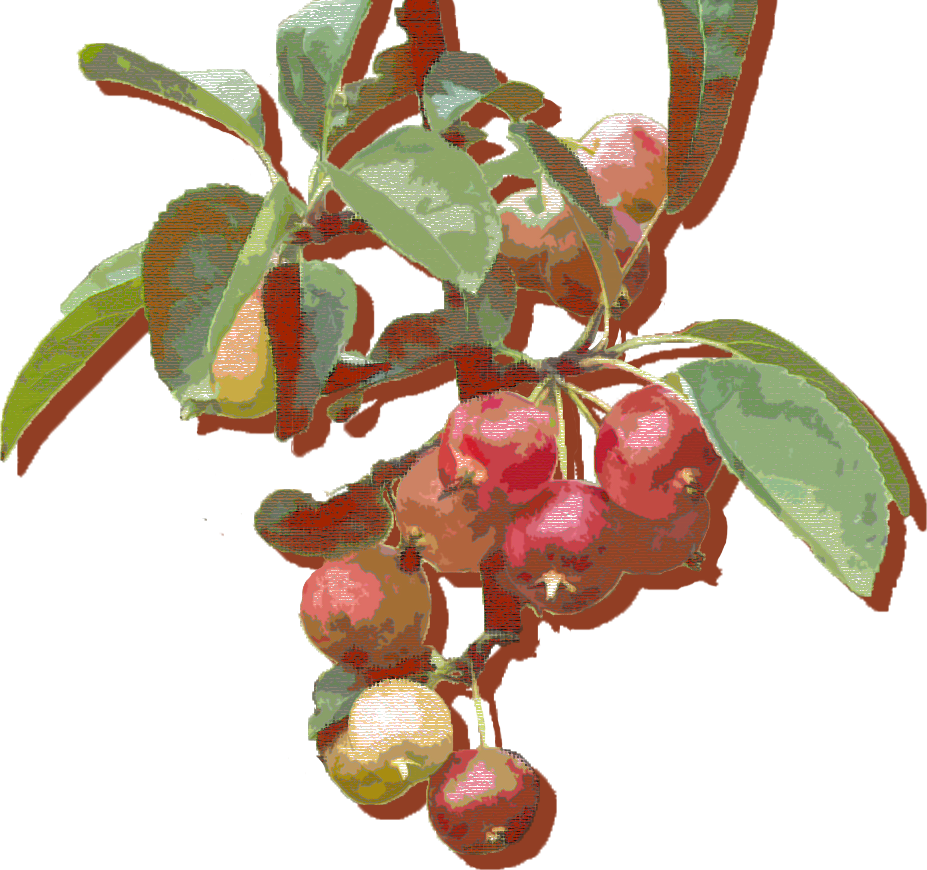

Infographic training continue…
I tried to achieve a silkscreen printing style like Suloni suggested:
Project: STA Hiring Poster
completion status: in progress
staff guidance/team: De’Sha, Maddy
description/plans: Drafting for STA hiring flyer copy
I worked with De’sha and Maddy to write up a flyer copy for our hiring poster. I was out on Wednesday so kind of fell behind on this assignment, thankfully De’sha was able to keep up with Maddy and Suloni’s edits.
These are some layout draft I worked on but didn’t get to post


Project: Brand System Training
completion status: in progress
staff guidance/team: Valerie, Abriella
description/plans: Designing the brand system for Fairy Forest Cafe
To be completed: This week
I started laying out text and images for the brand book, this is what I have so far:

I’ll design the logo and work on adding more elements such as shapes & illustrations next.
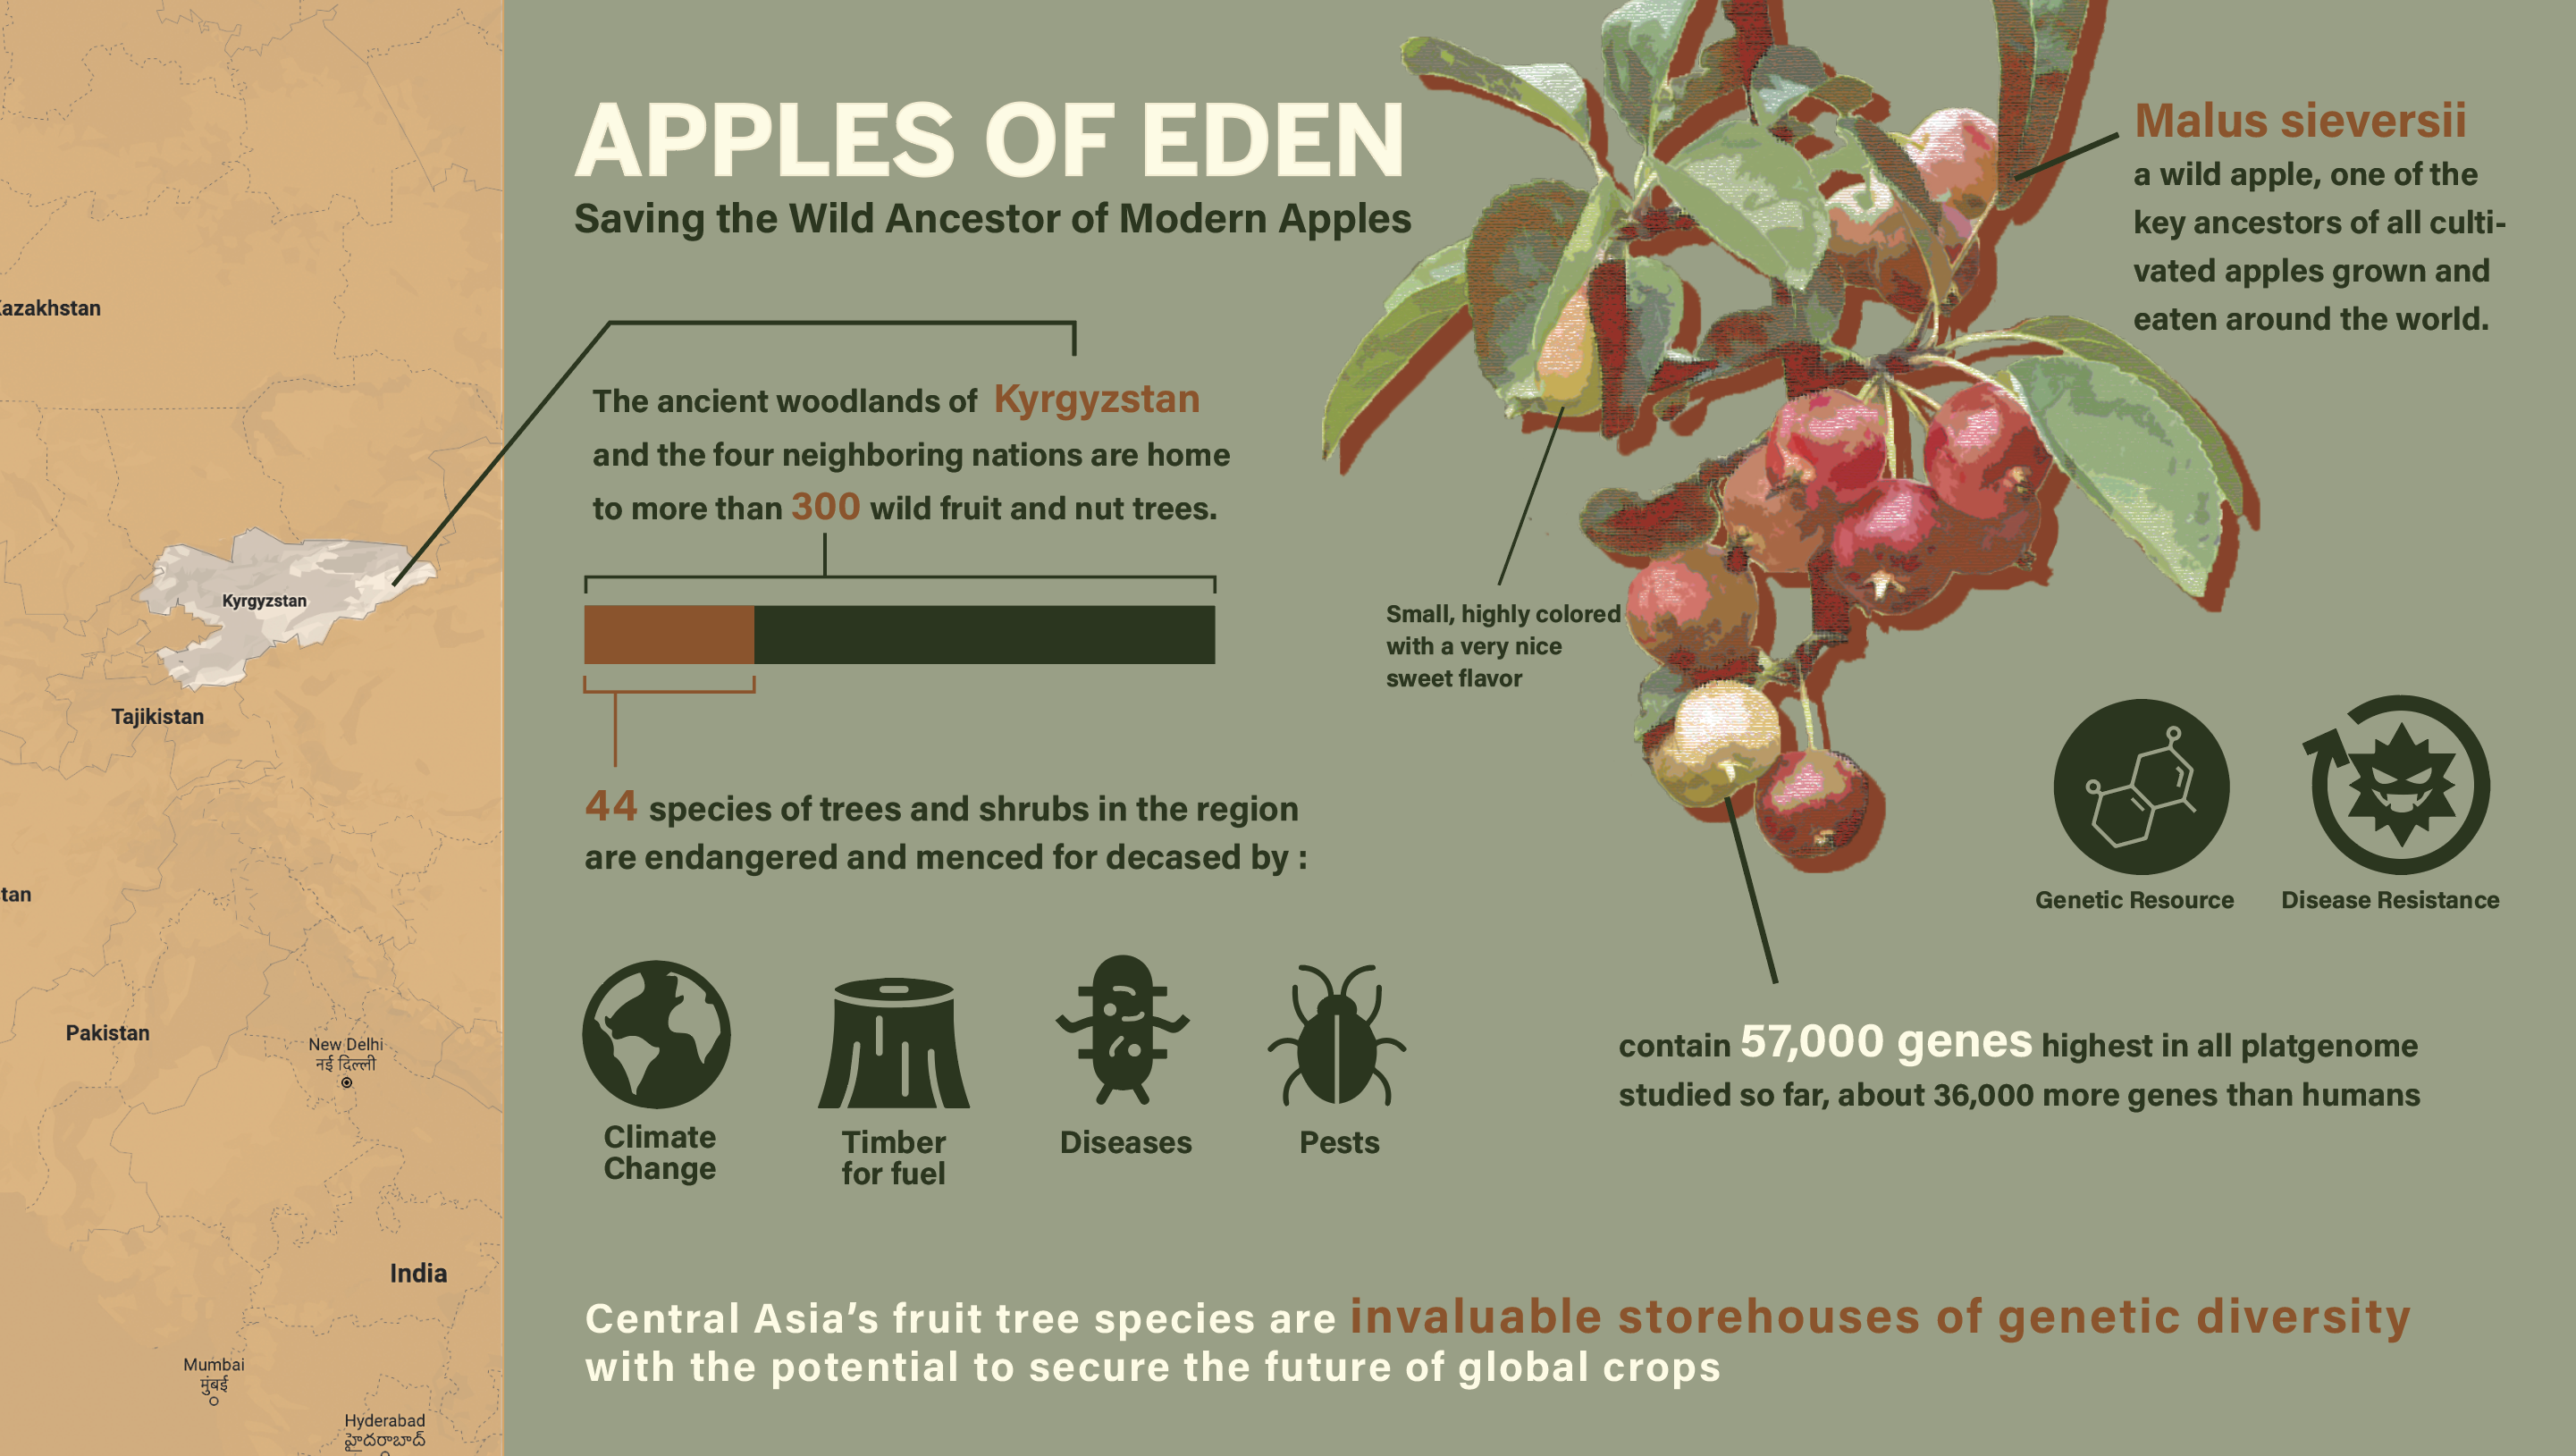
Project: Infographic training
completion status: completed
staff guidance/team: Valerie, Angie, Megan
description/plans: Designing an infographic
Layout draft:
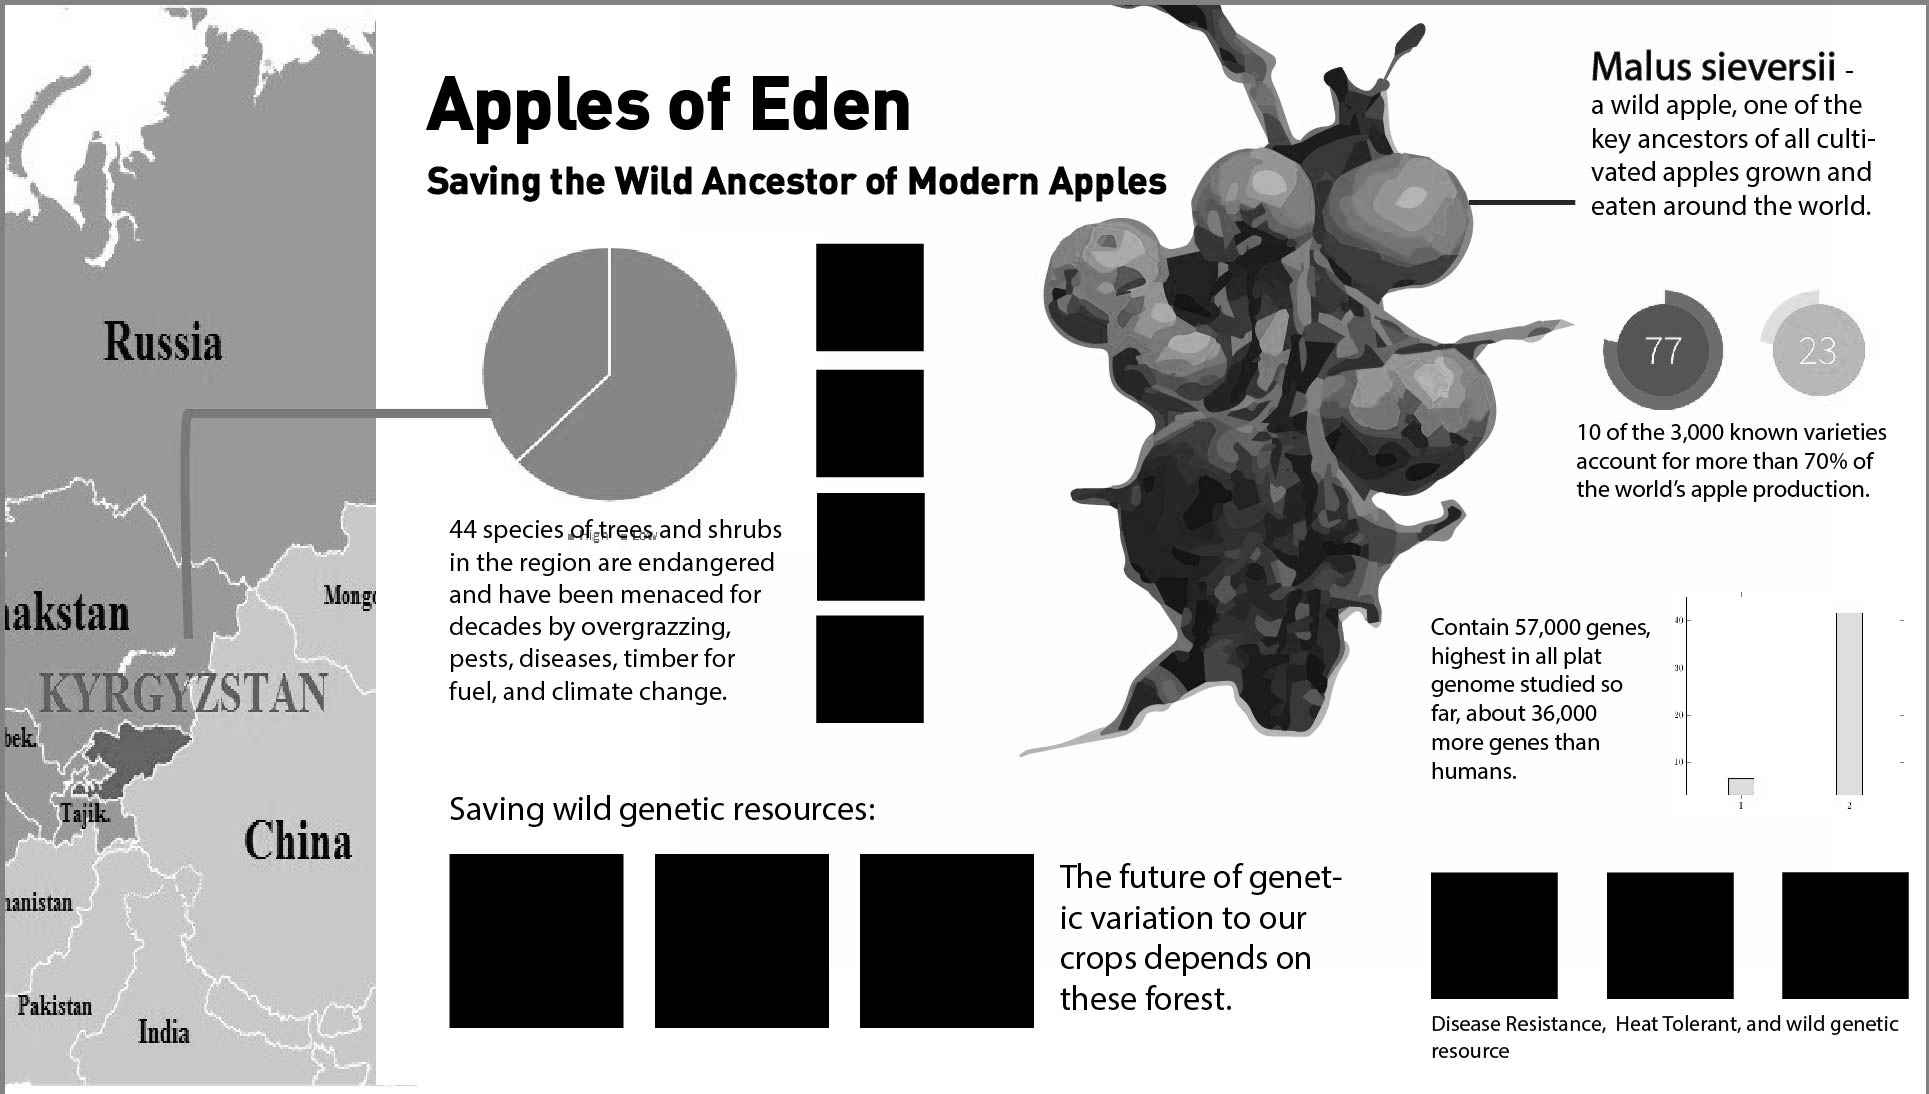
Colored draft with statistics:
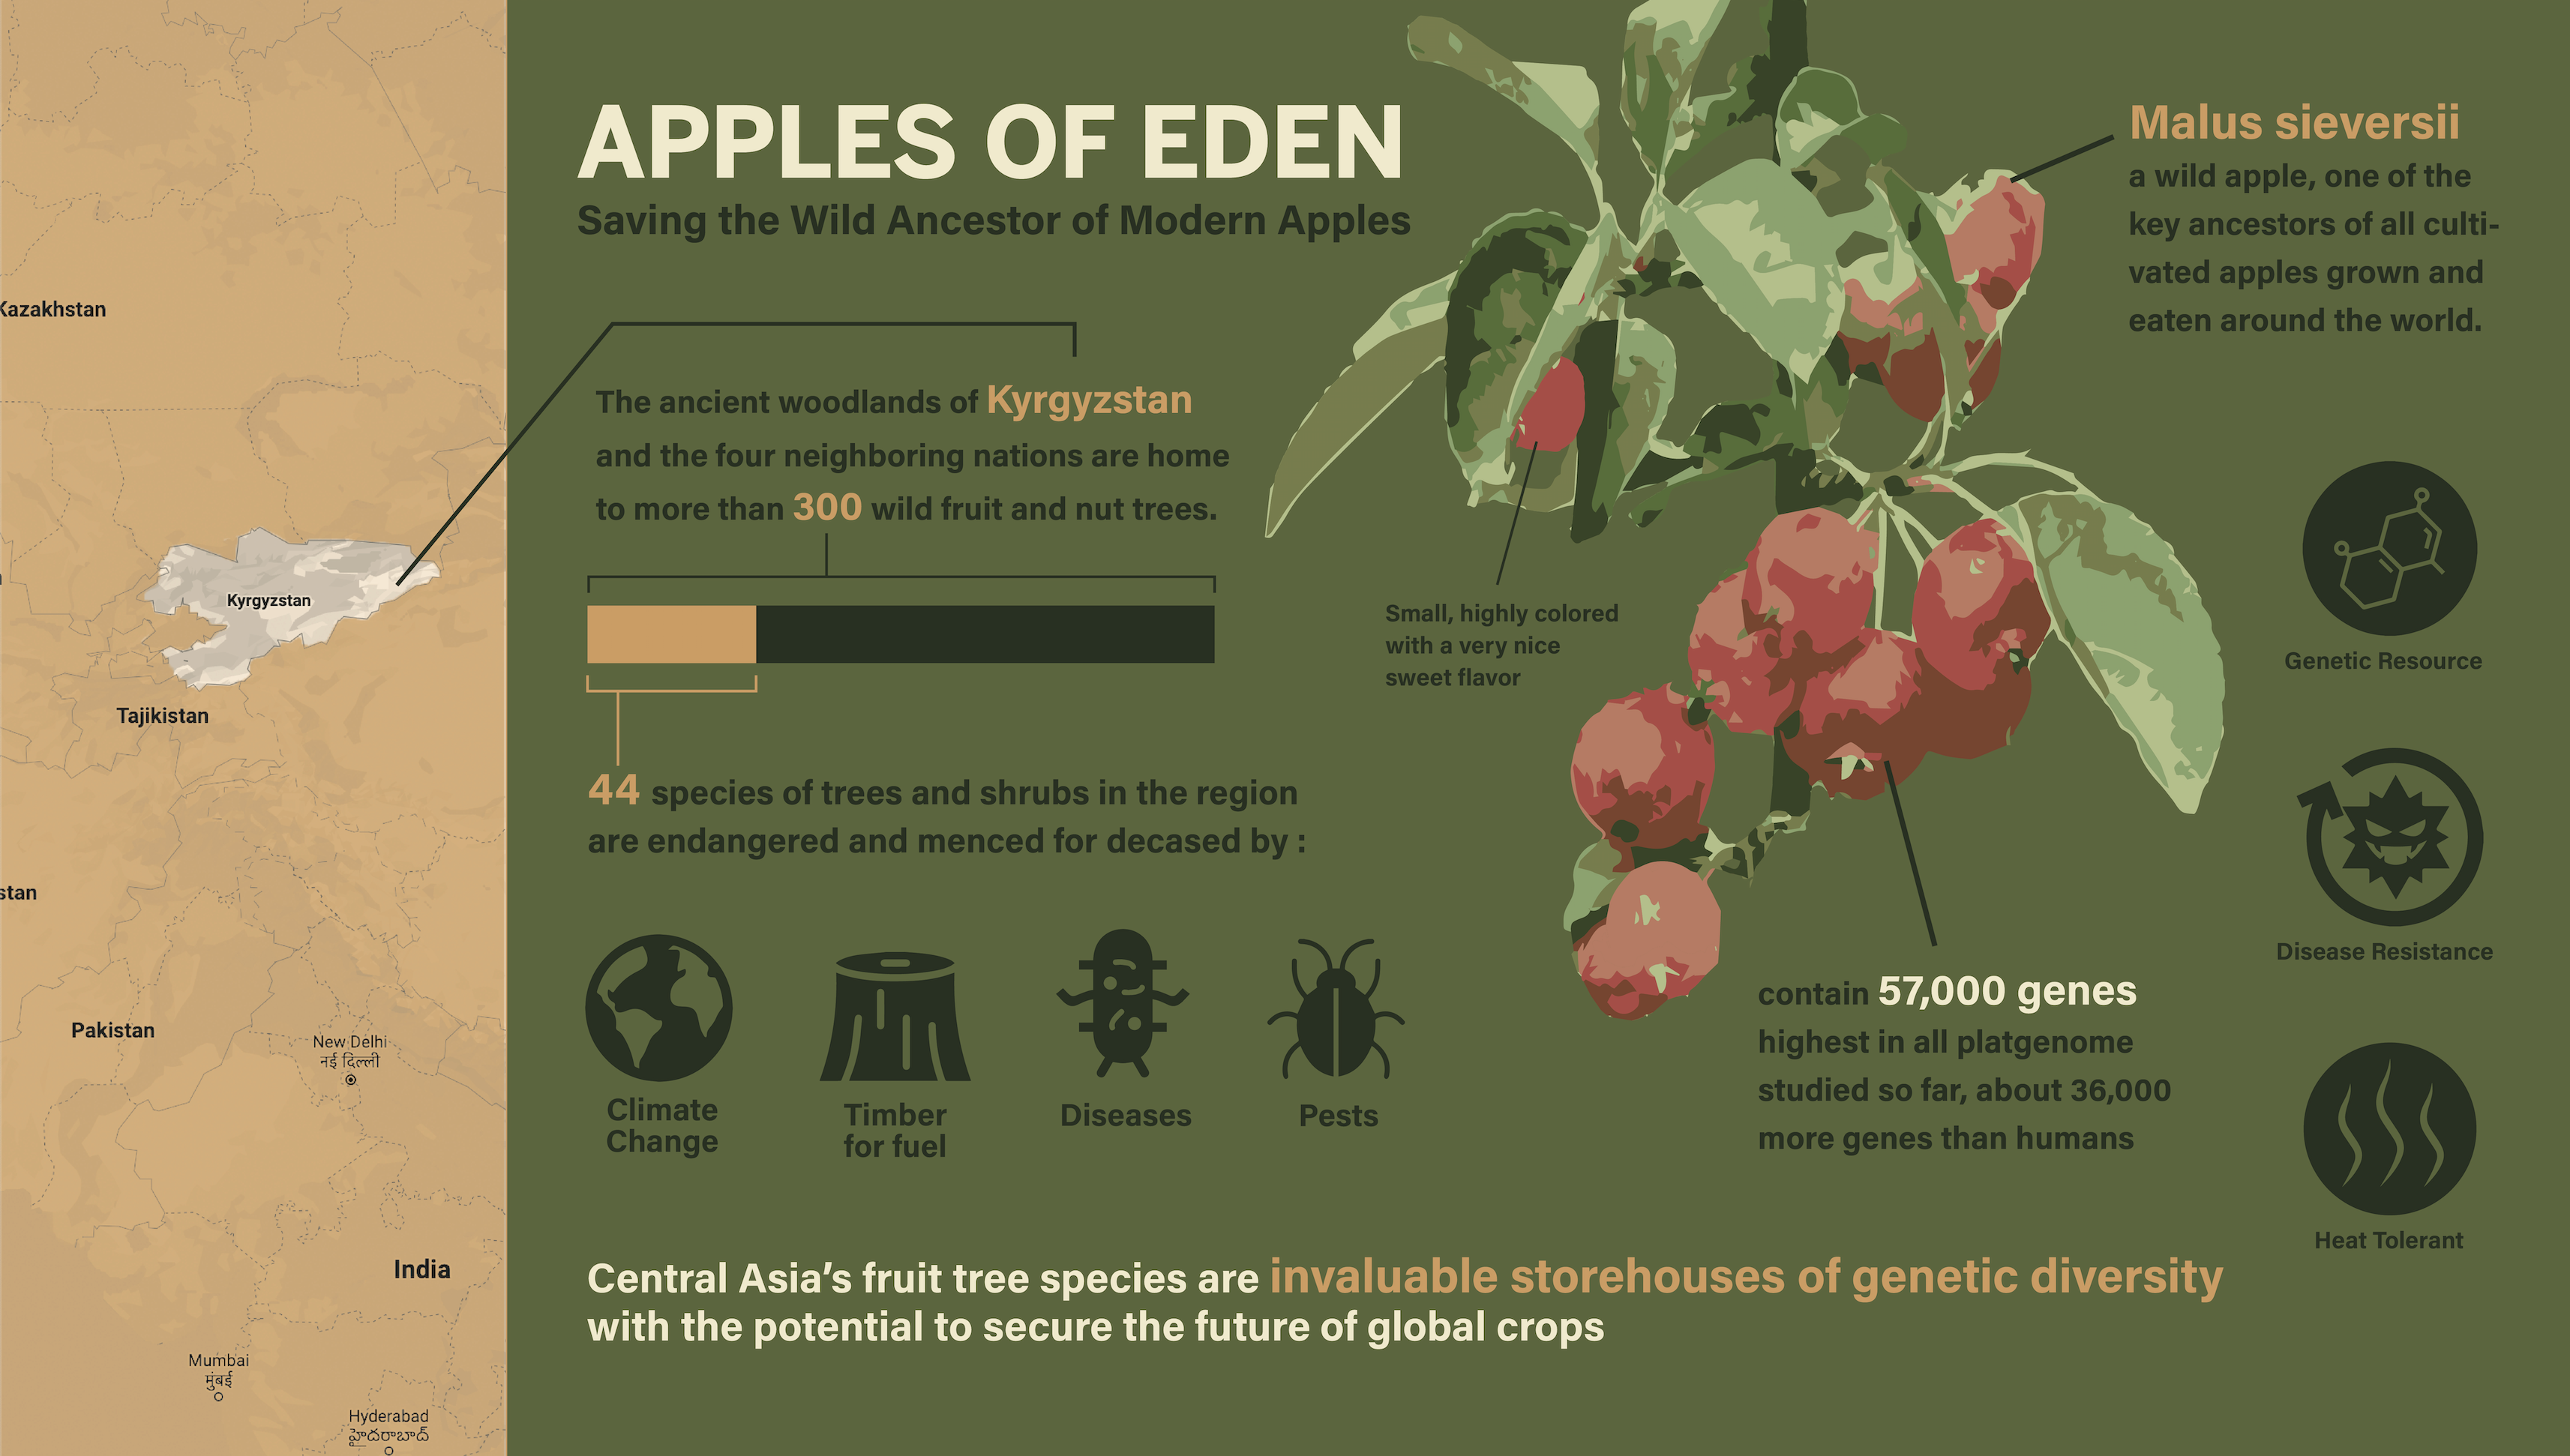
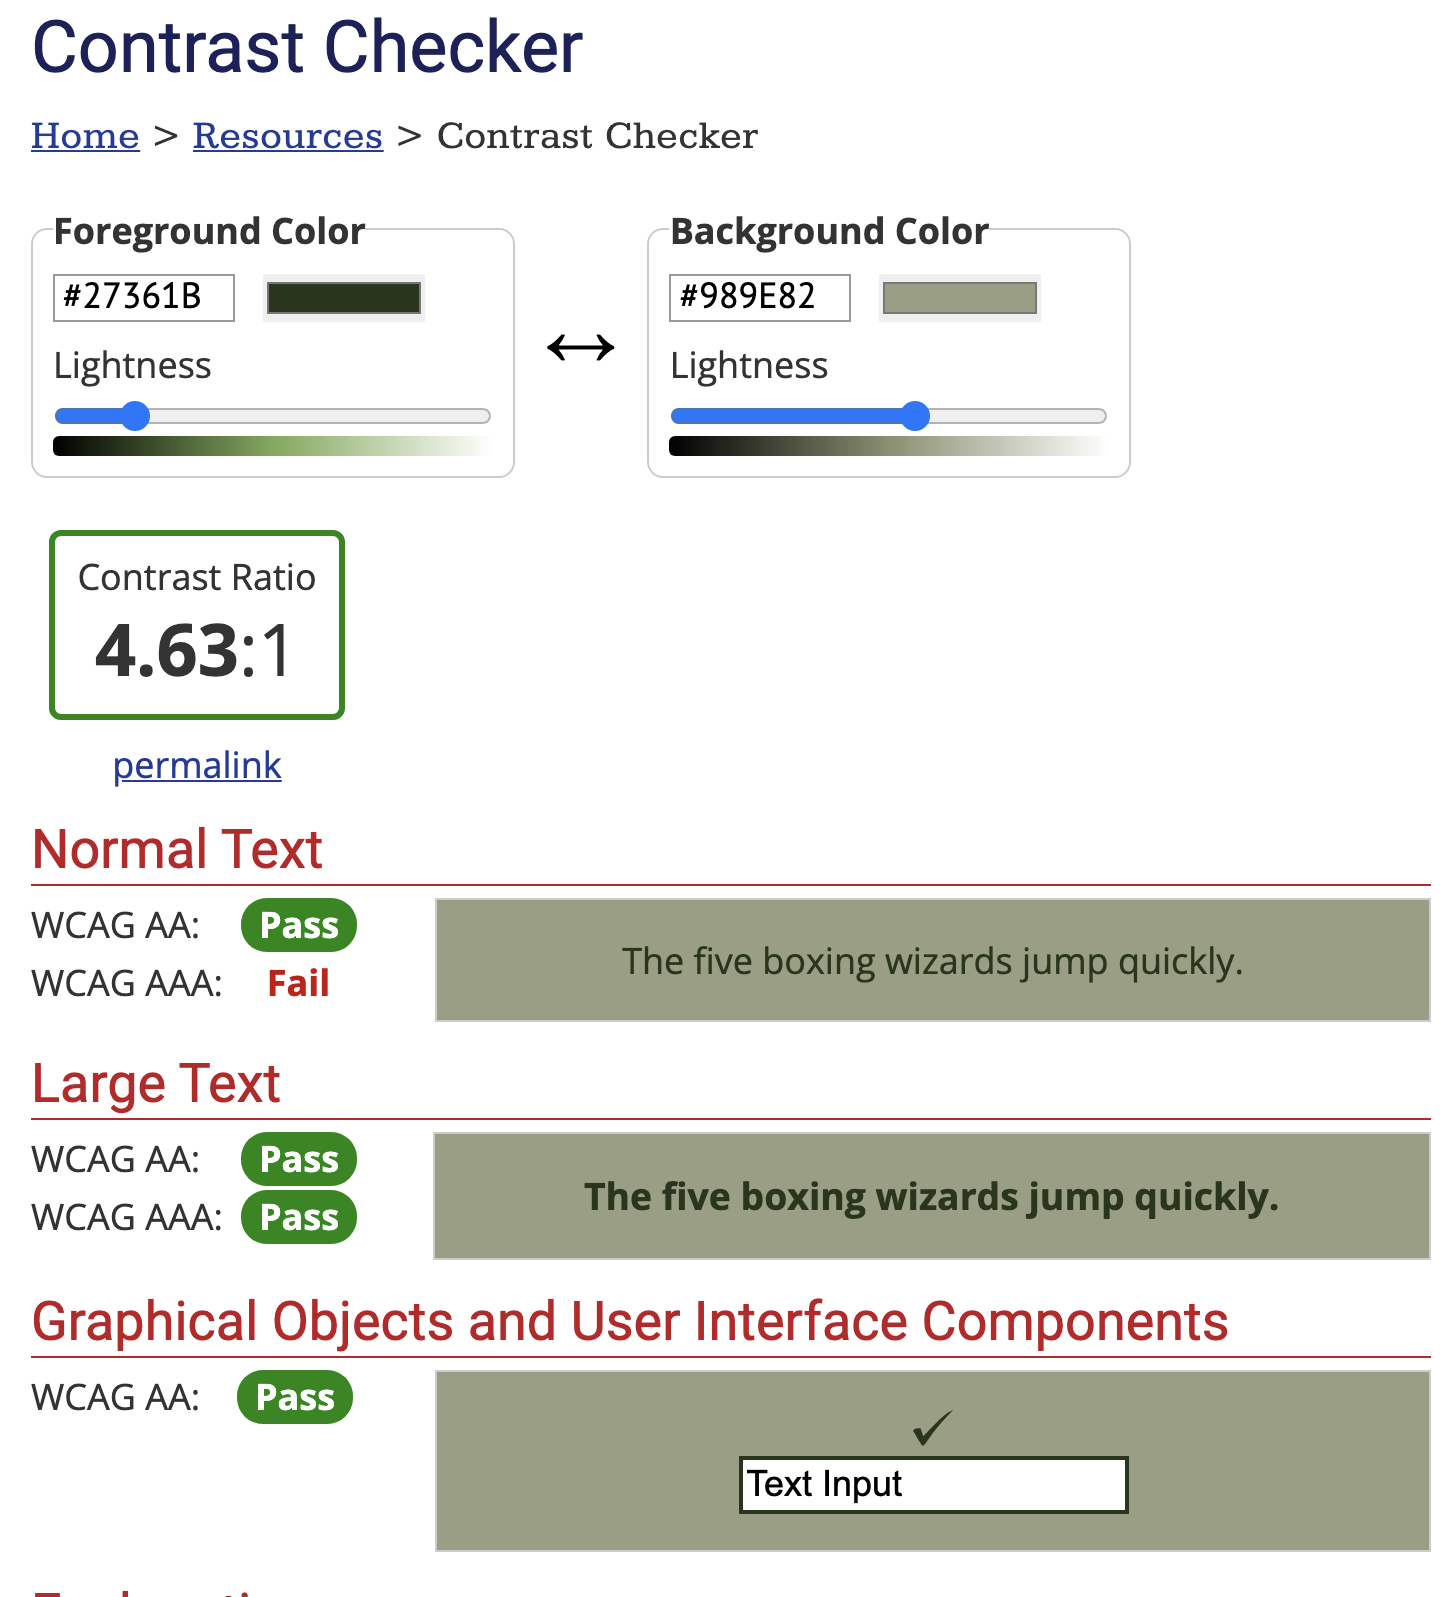
Megan pointed out that the darker green text might not have enough contrast, so I switched to a lighter background and fixed alignment and spacing

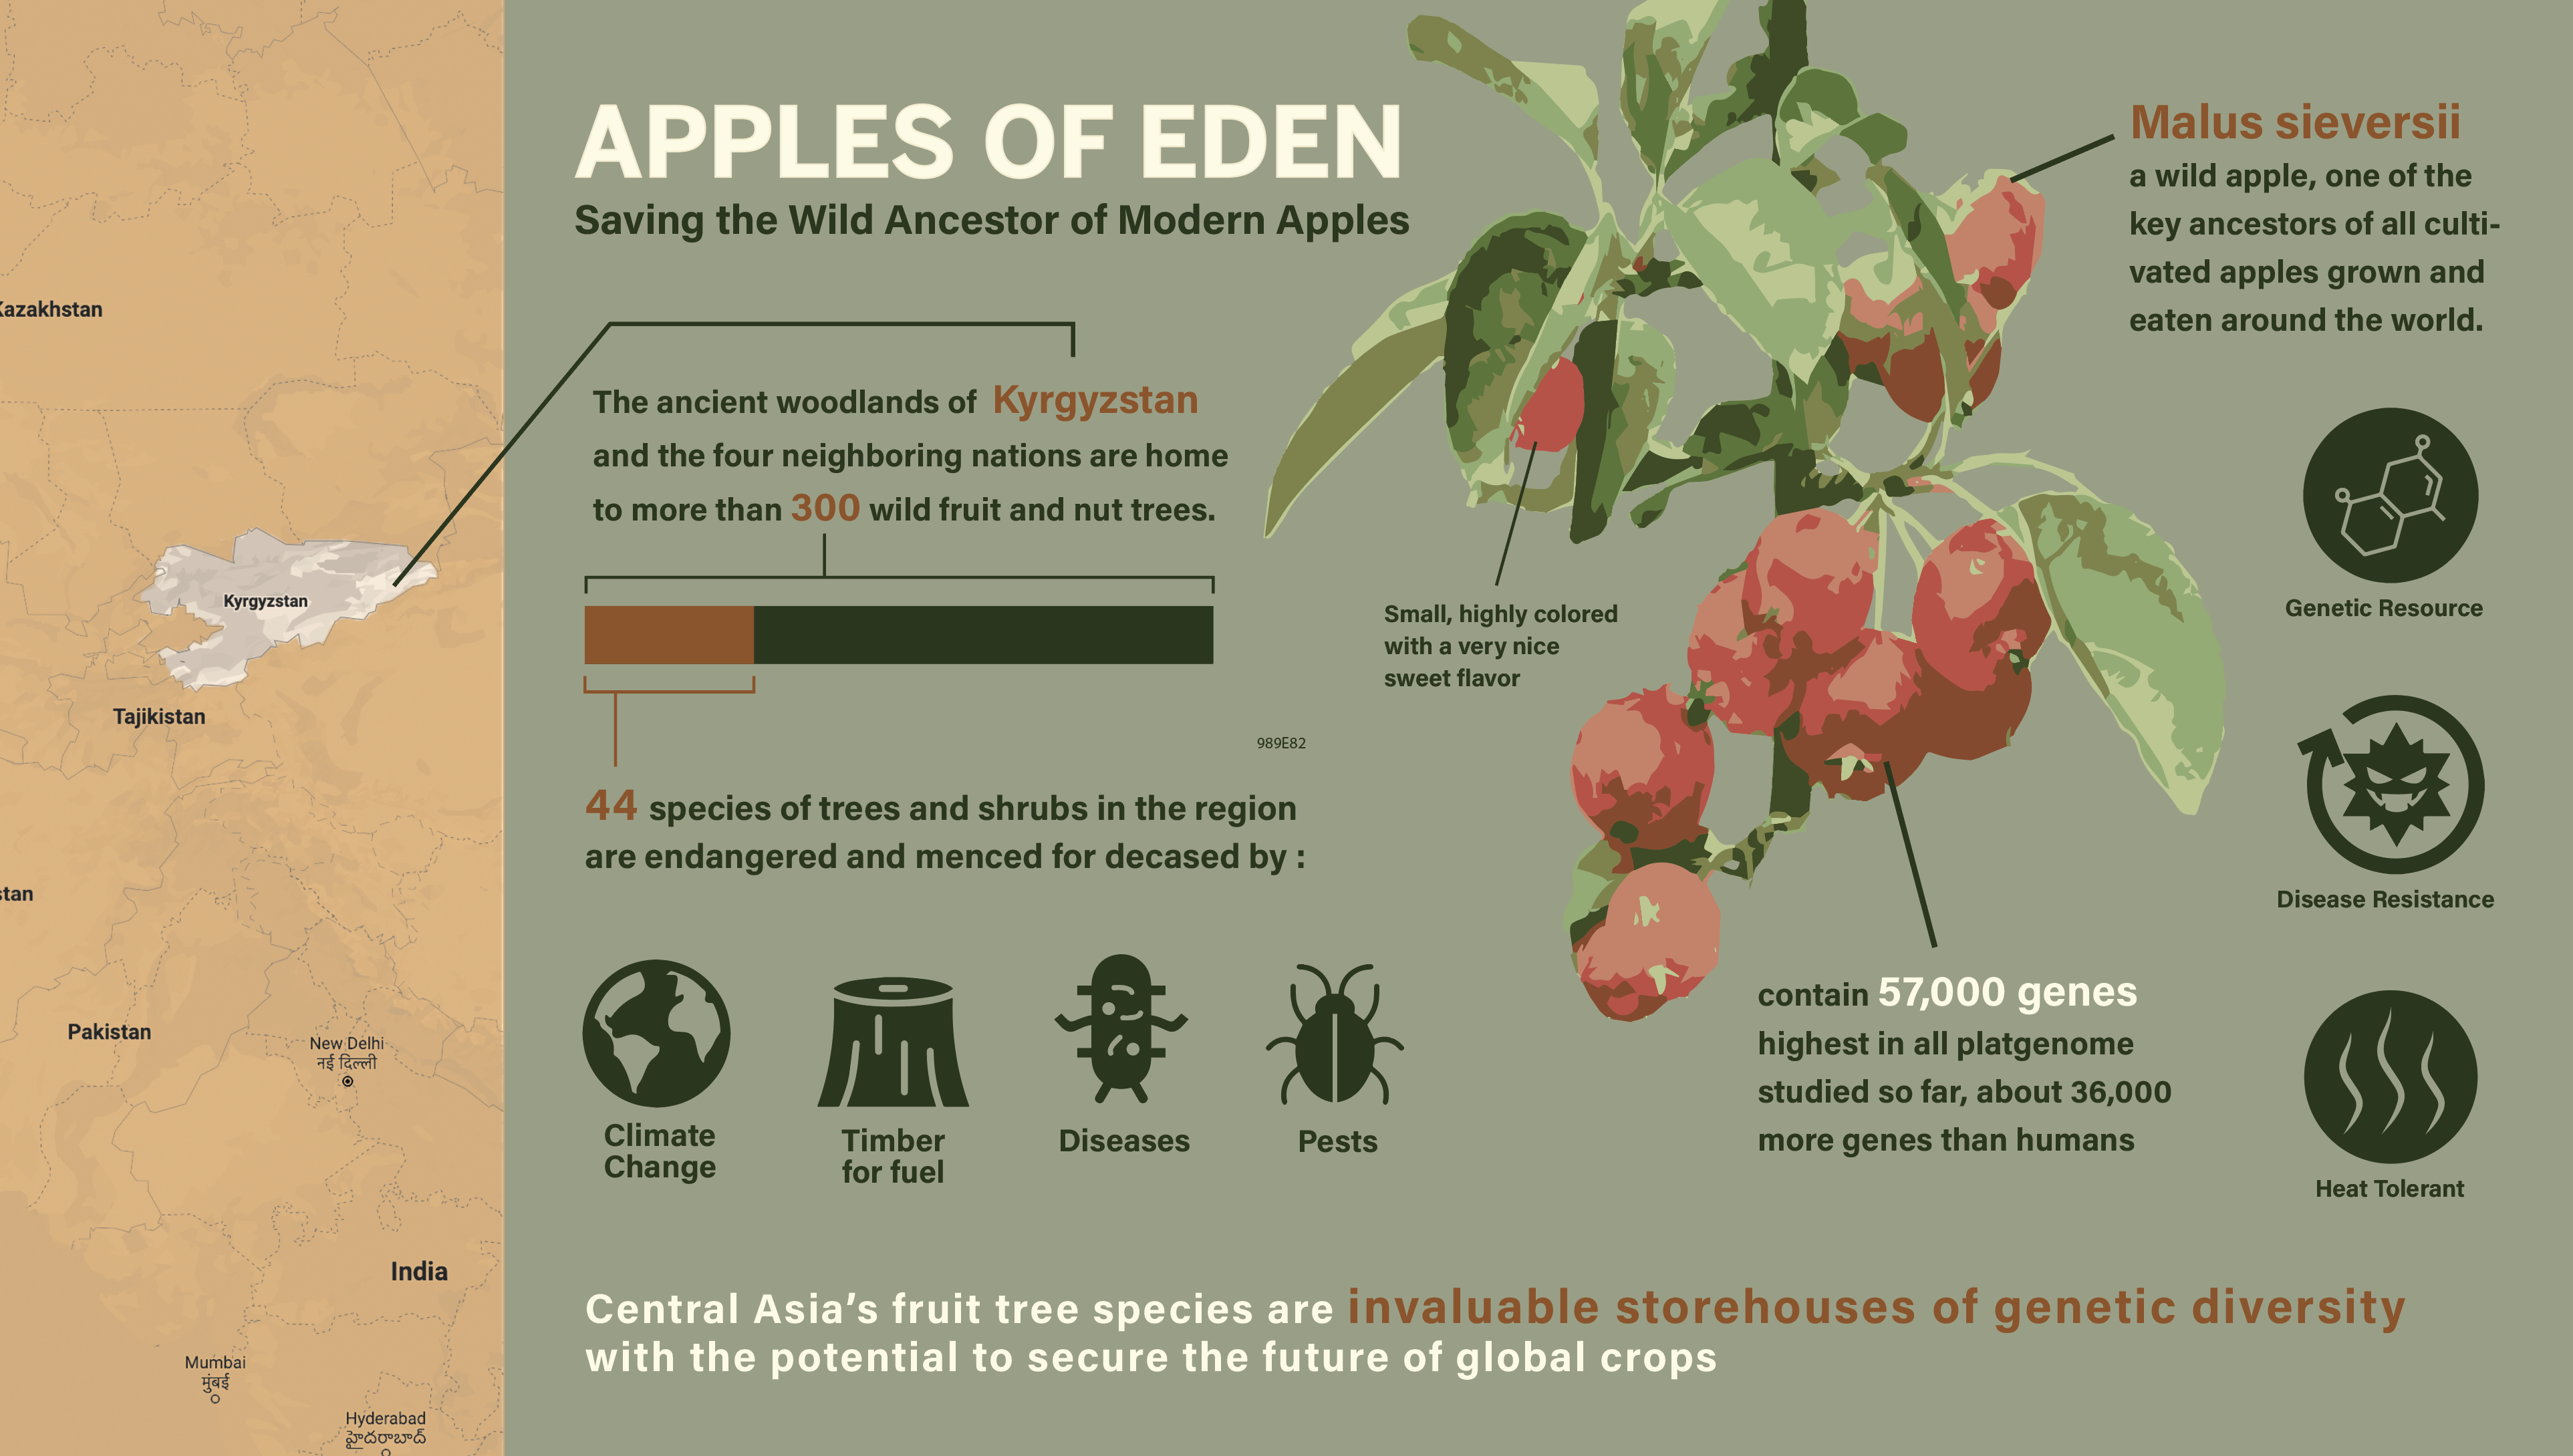
Final:
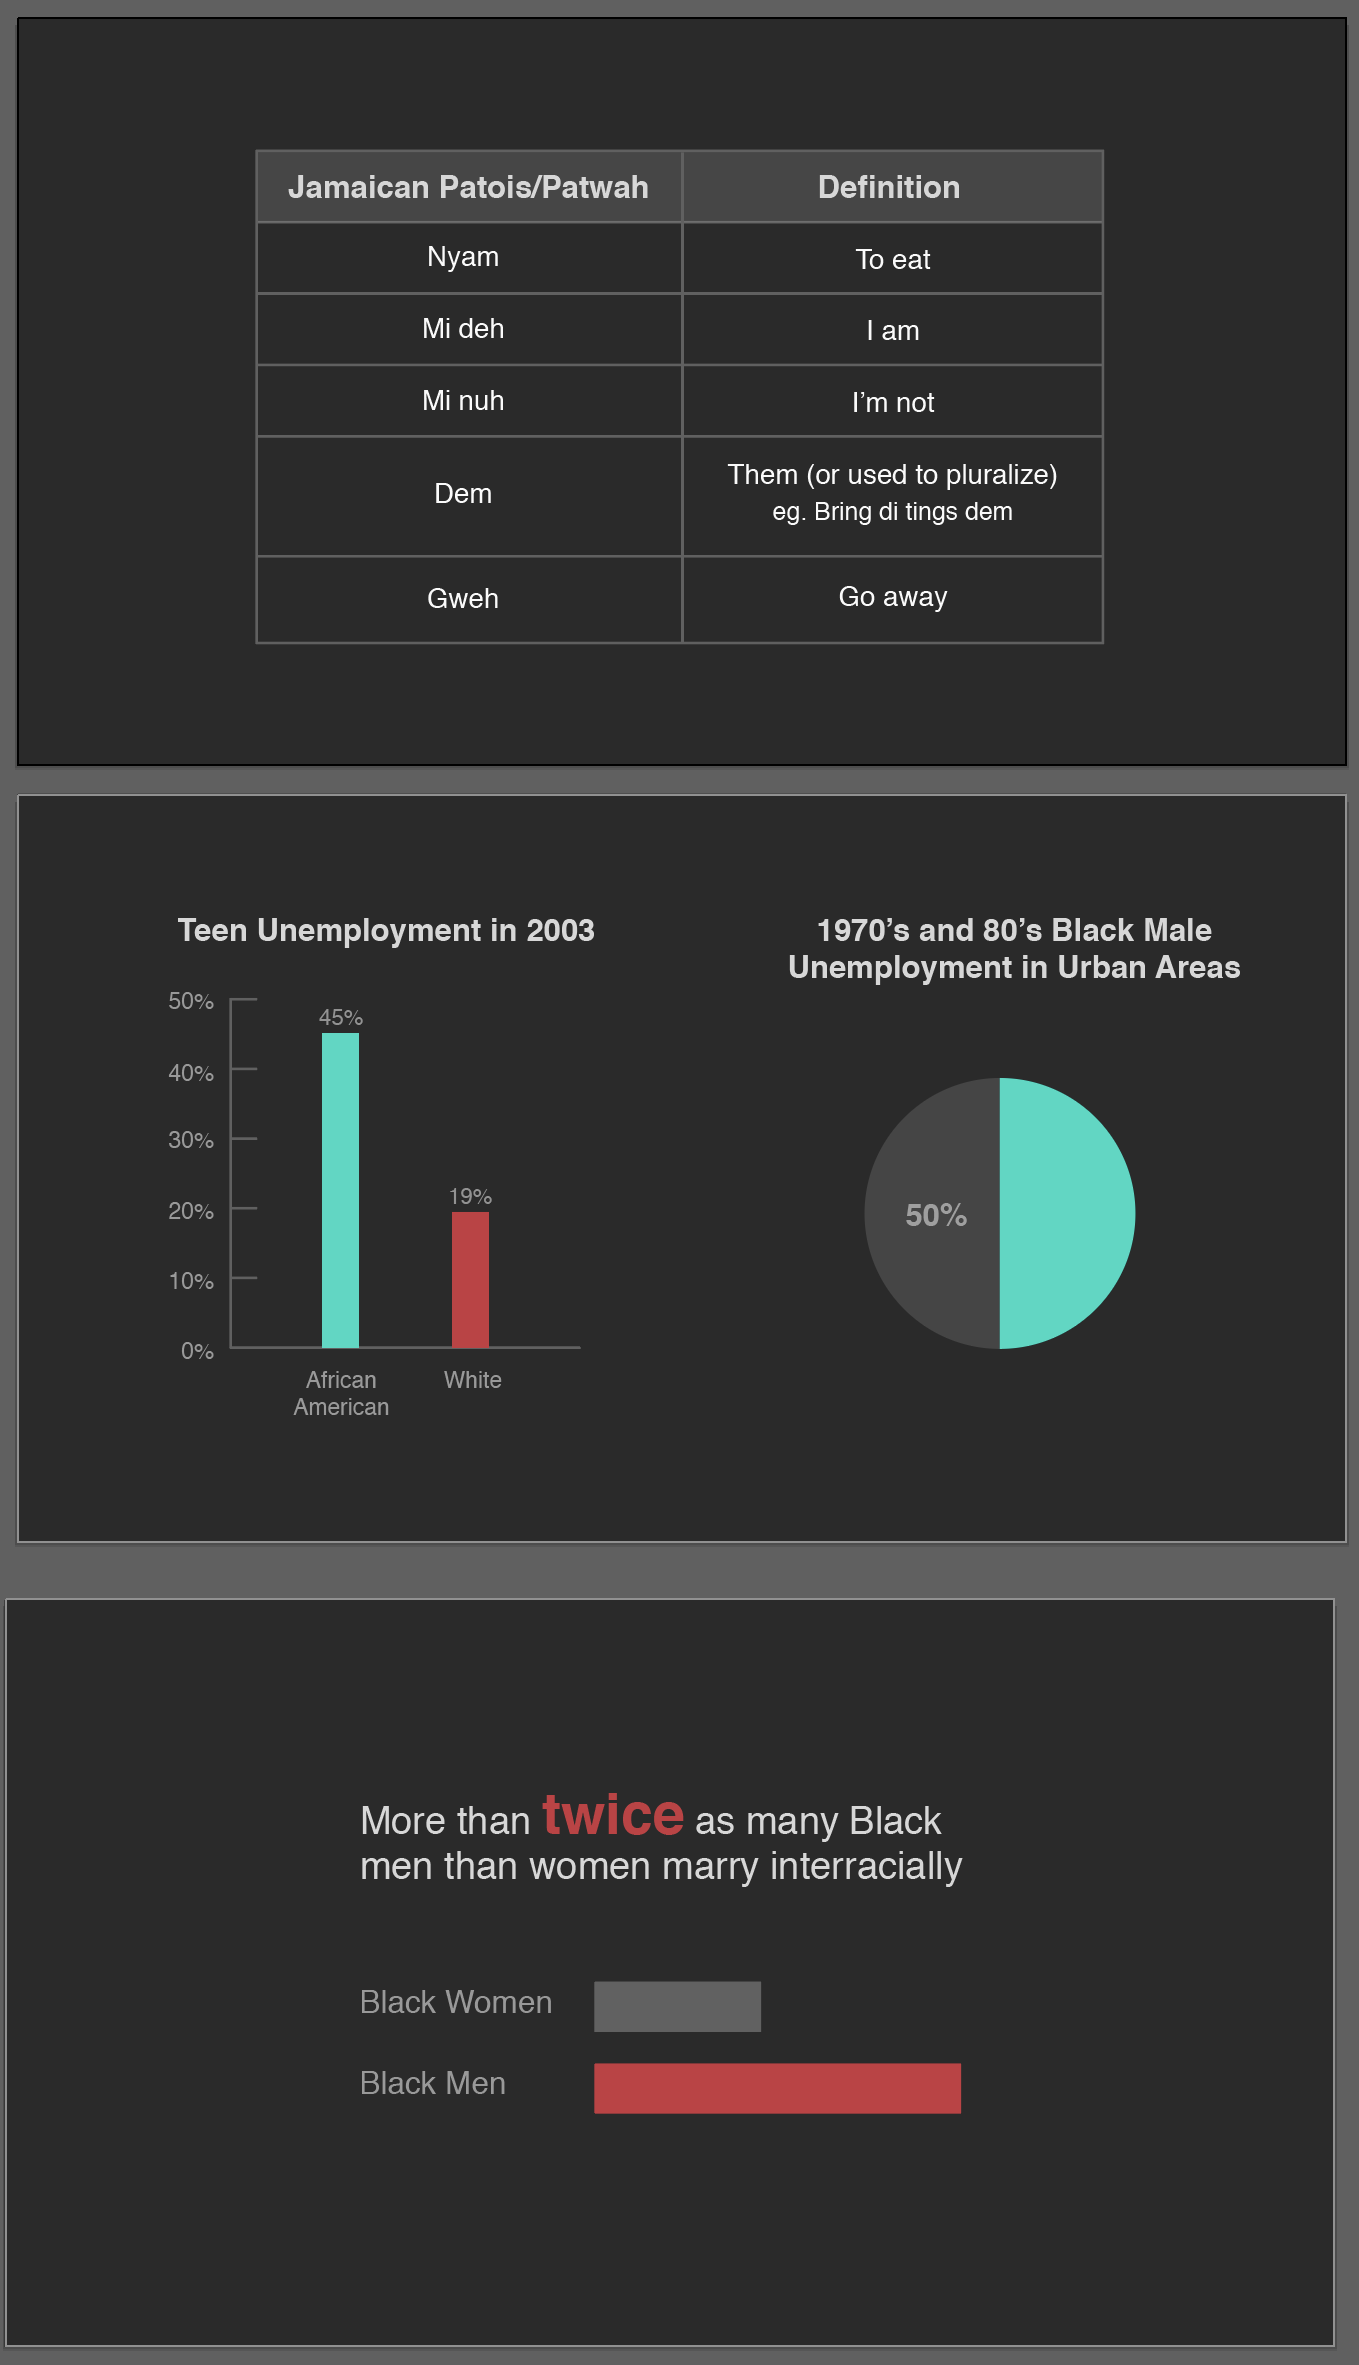
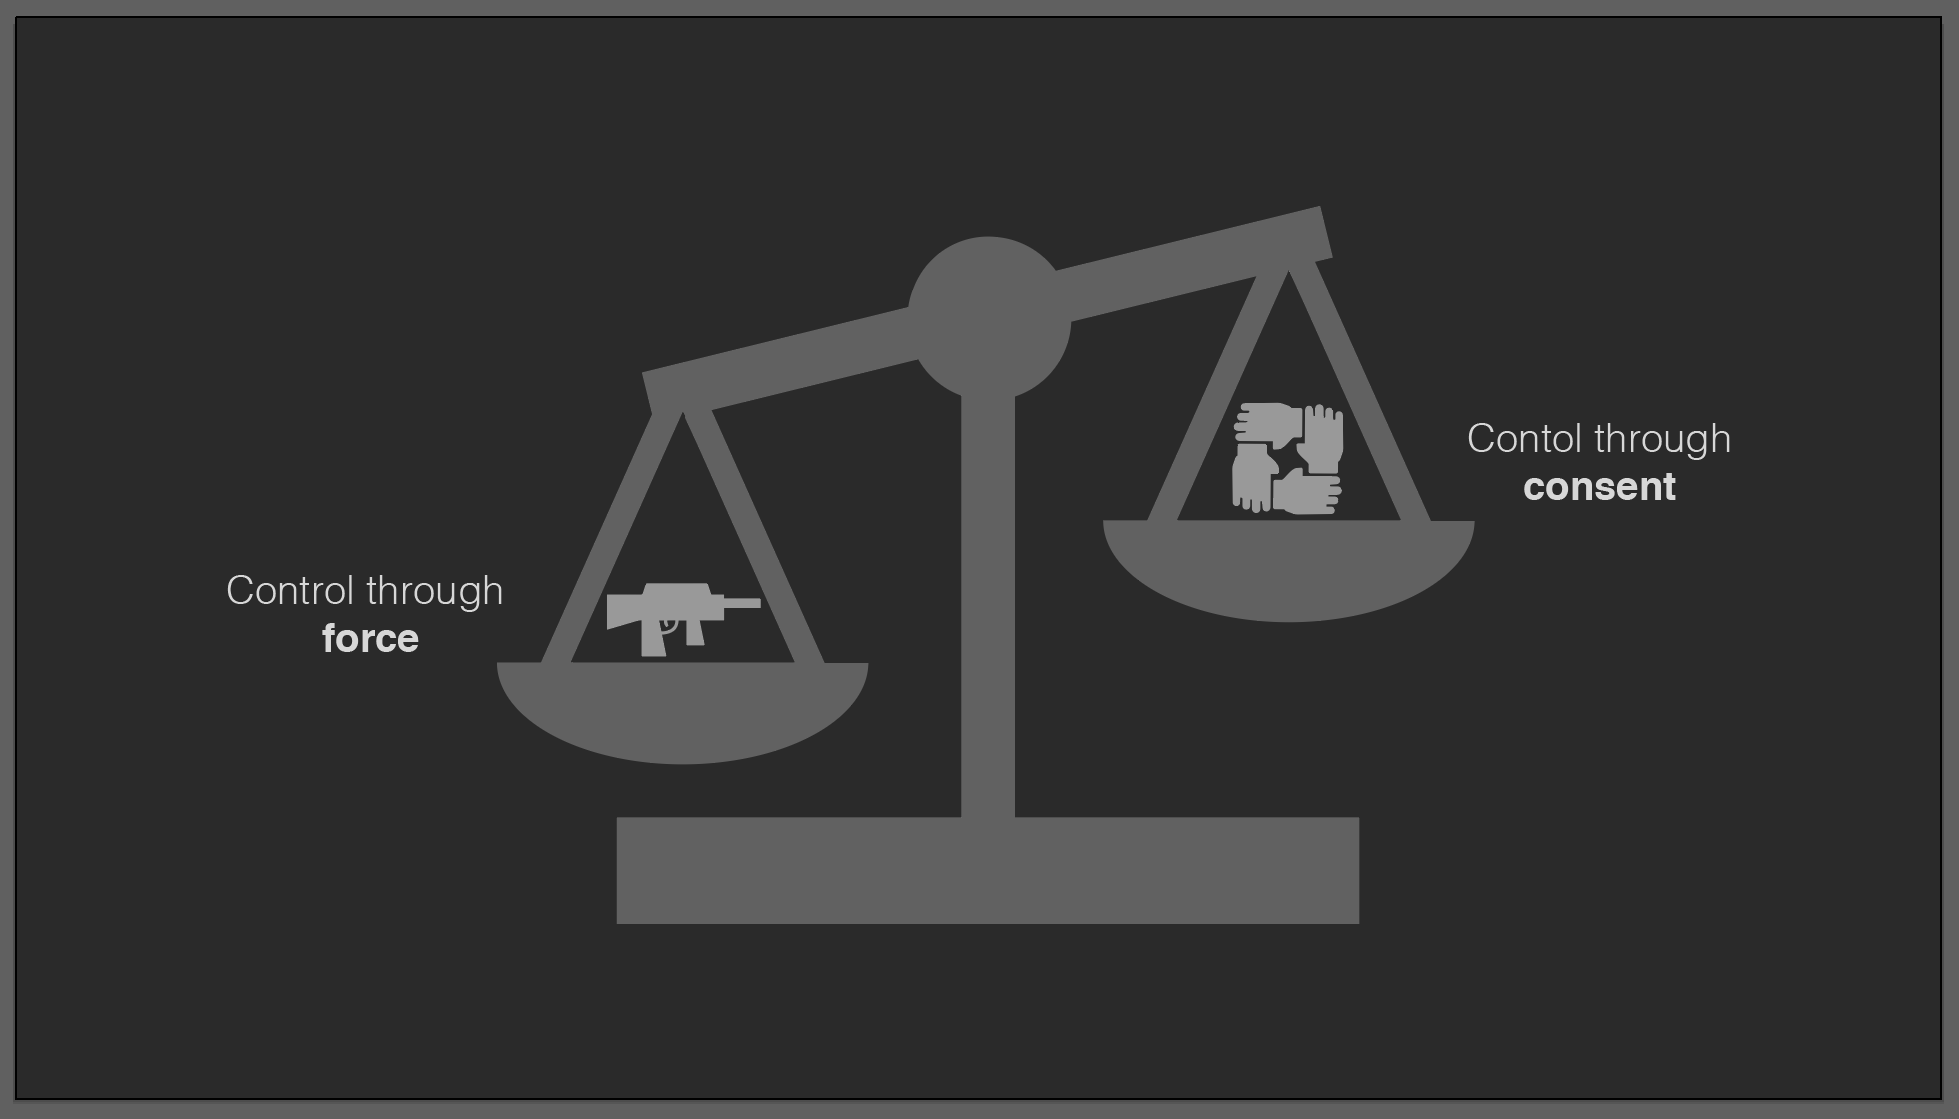
Project: AFR303 Intro to Black Studies
Client /Prof: Dr. Gordon, Dr.Colón
completion status: completed
staff guidance/team: Maddy, Abriella, and Rachel
description/plans: redesign graphics for presentation following the style guide
To be completed: Ongoing semester project!
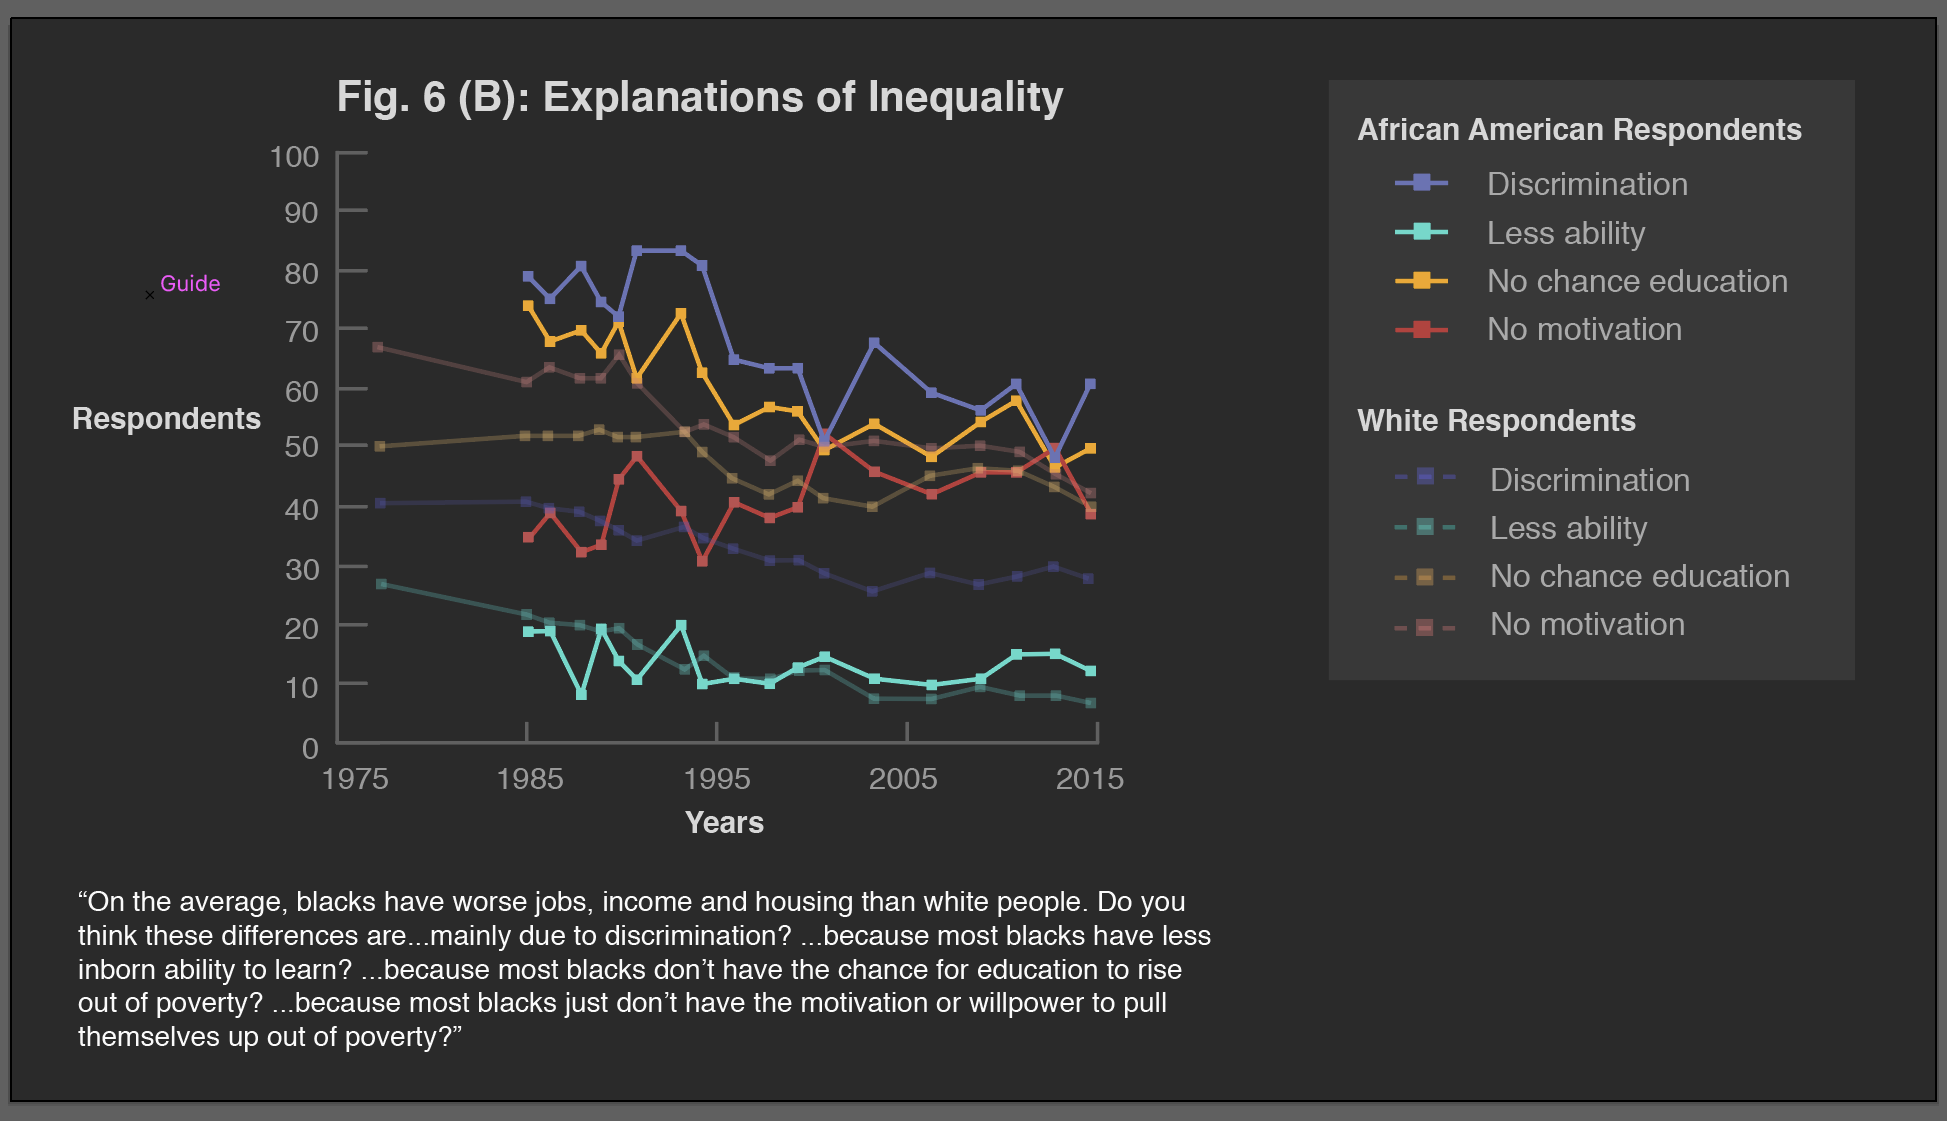
Explanation of Inequality graph:

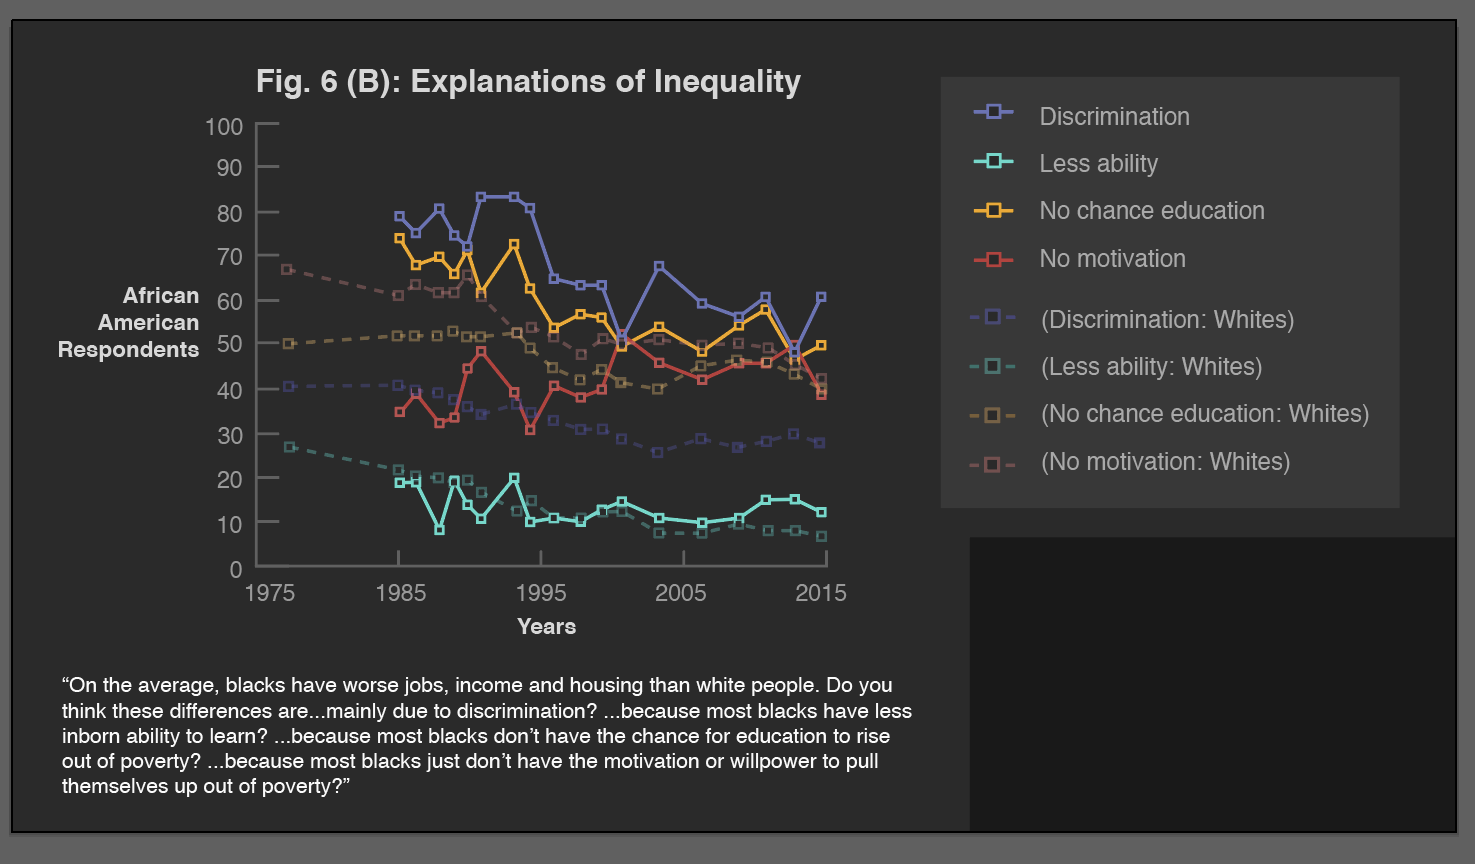
My first draft used dashed lines and empty squares as data points, which looked busy and kind of overwhelming. Abriella and Maddy suggested solid lines and solid data points, and the final result looks like this:
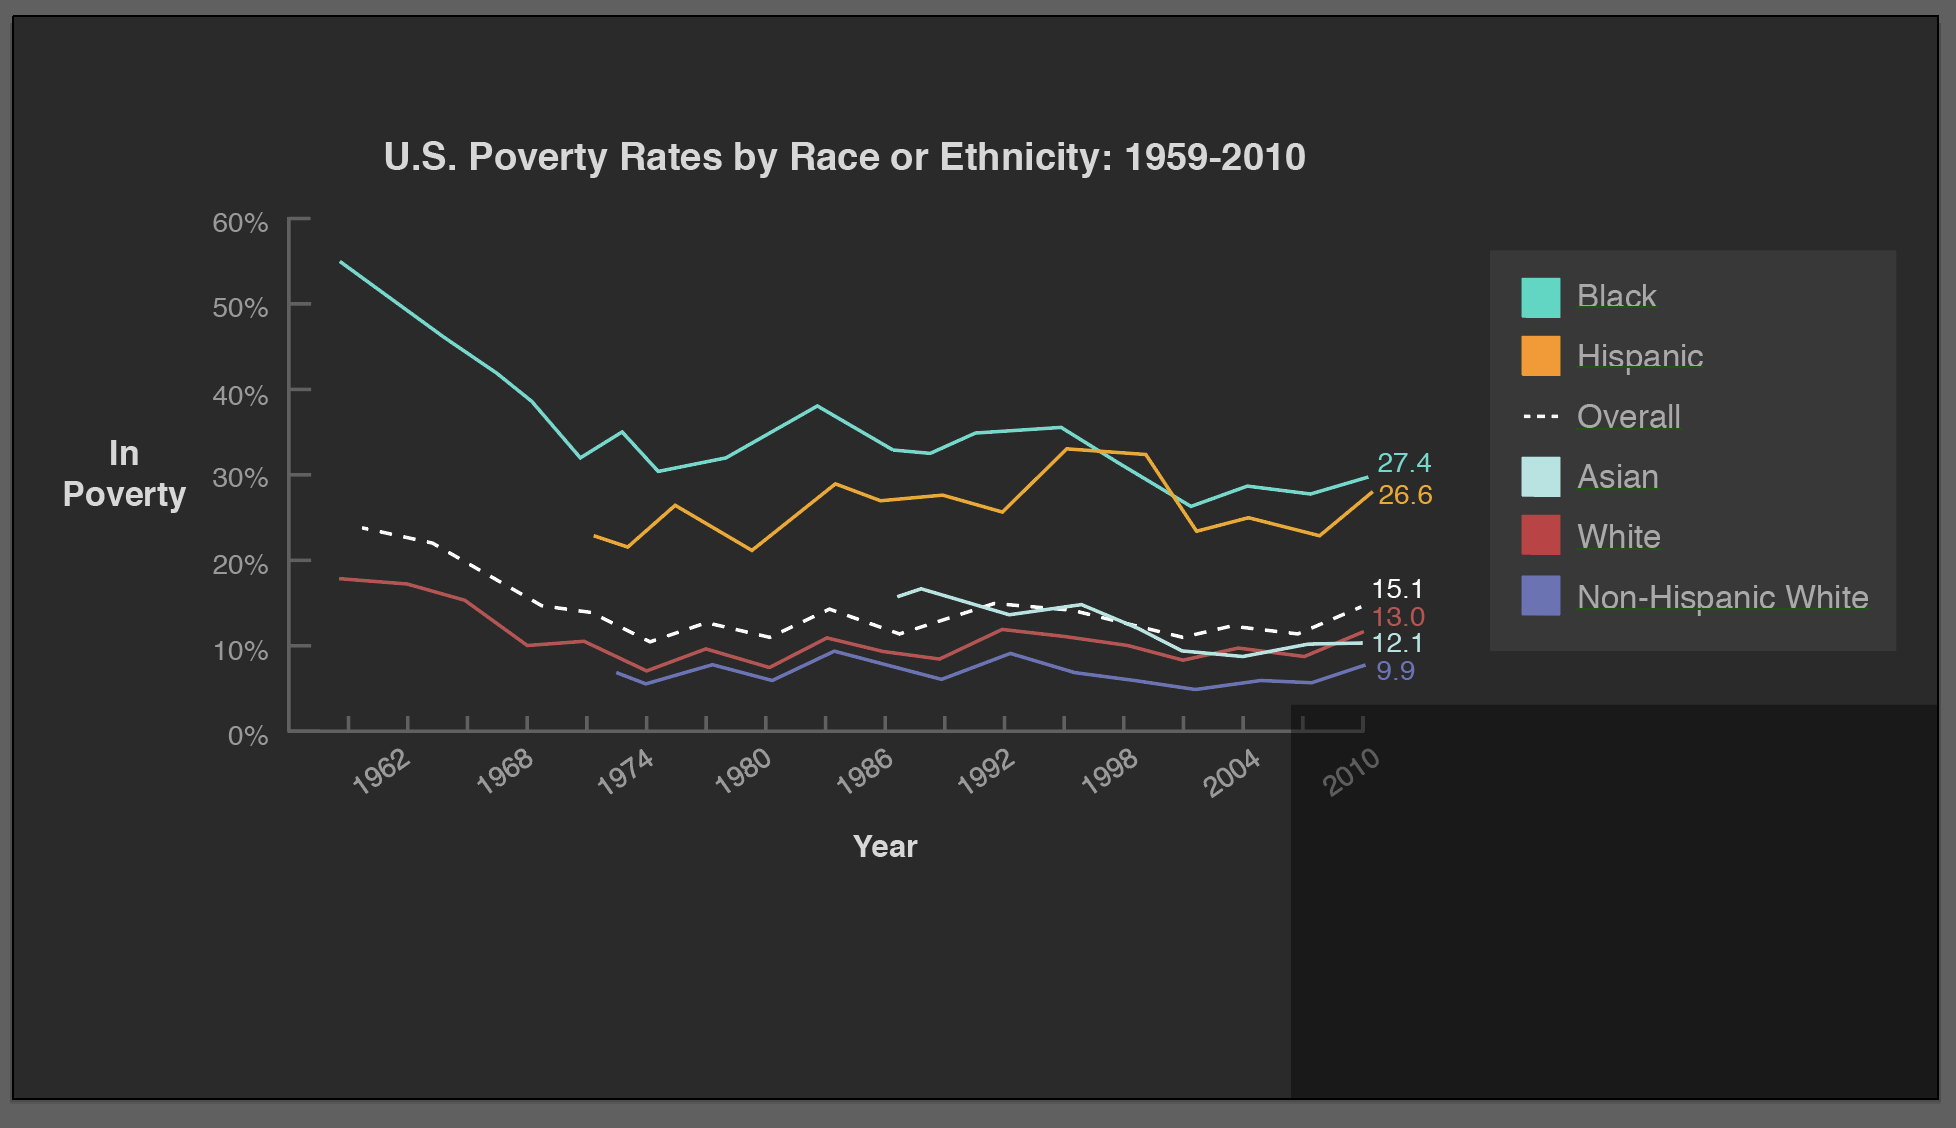
Poverty rates graph:

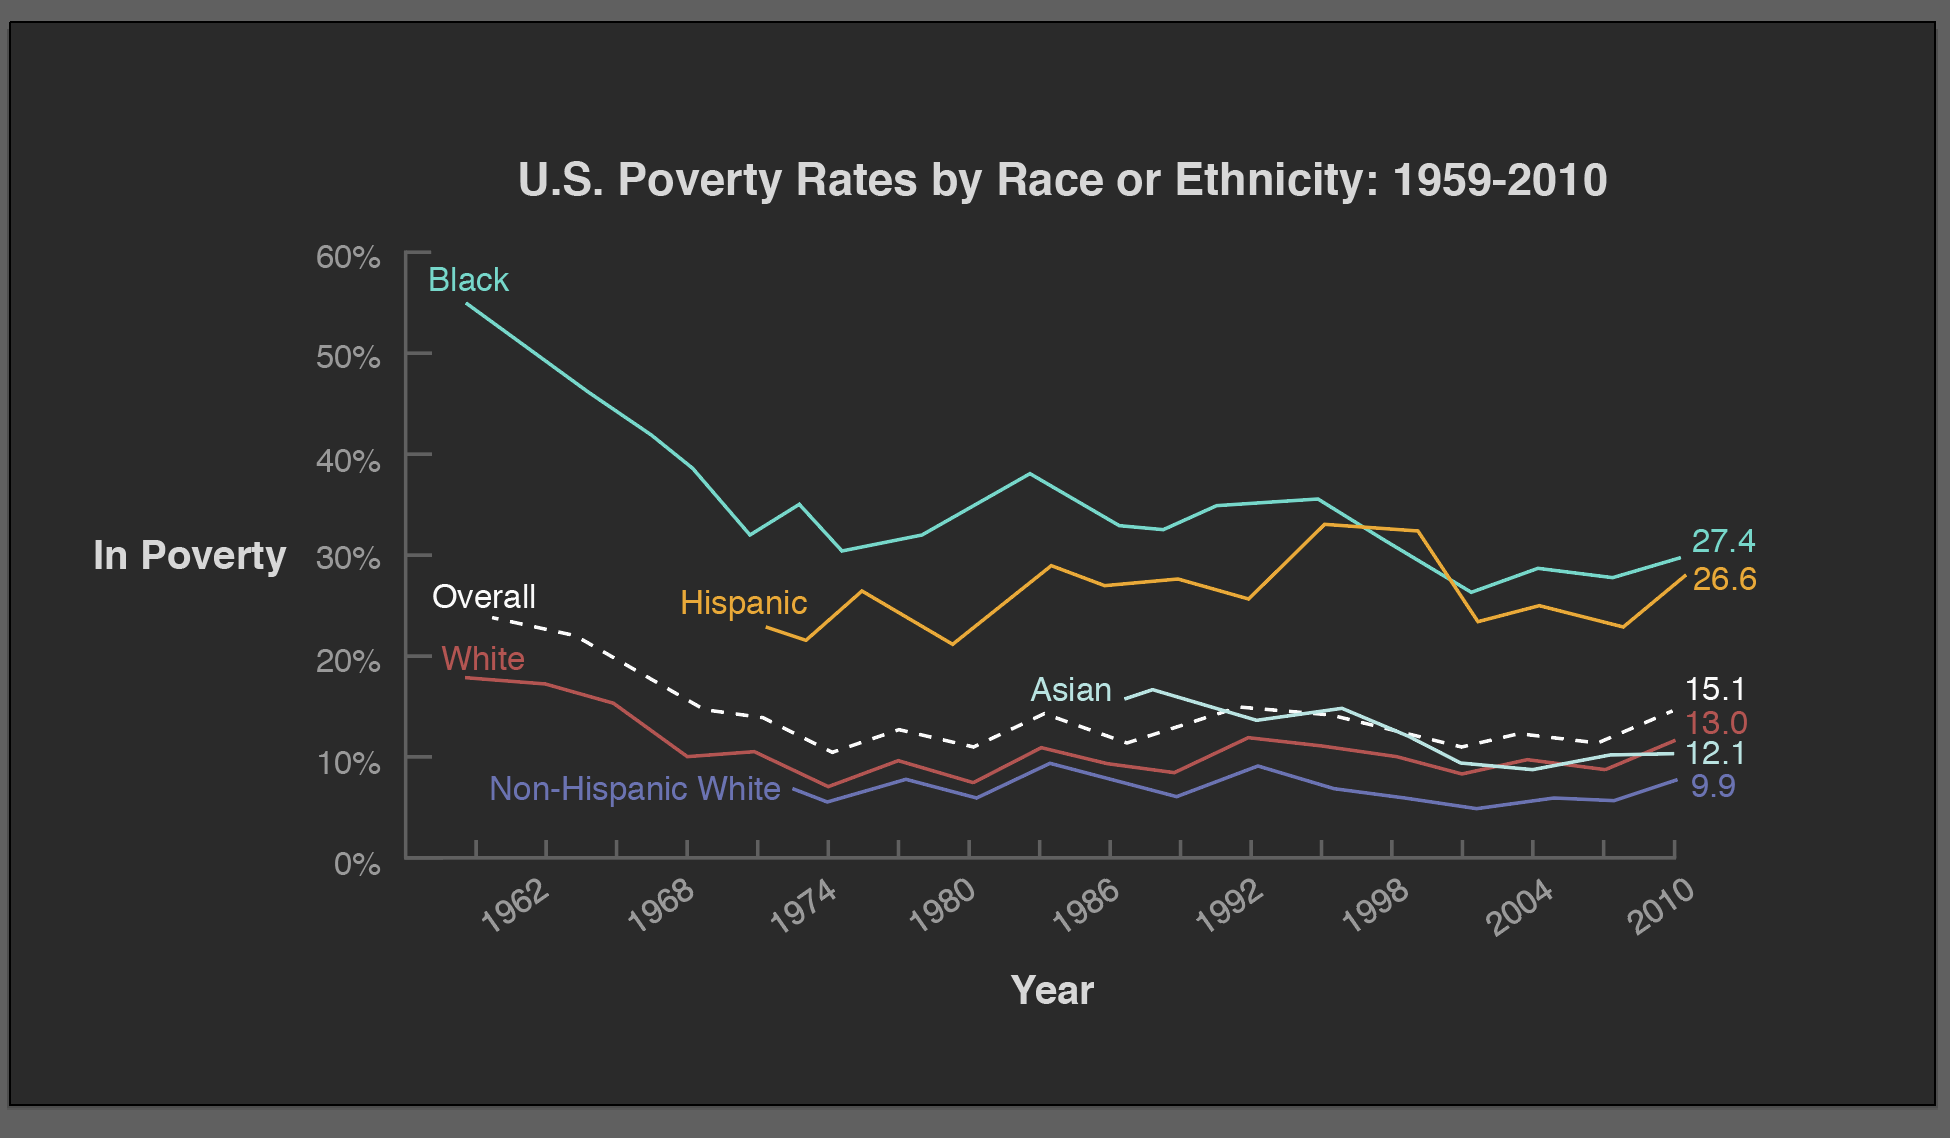
For my first draft, I decided to leave the labels in the graph for easier access, after discussing with Abriella and Rachel we decided that we should keep it consistent with our other graphics by taking the labels out and add a key.
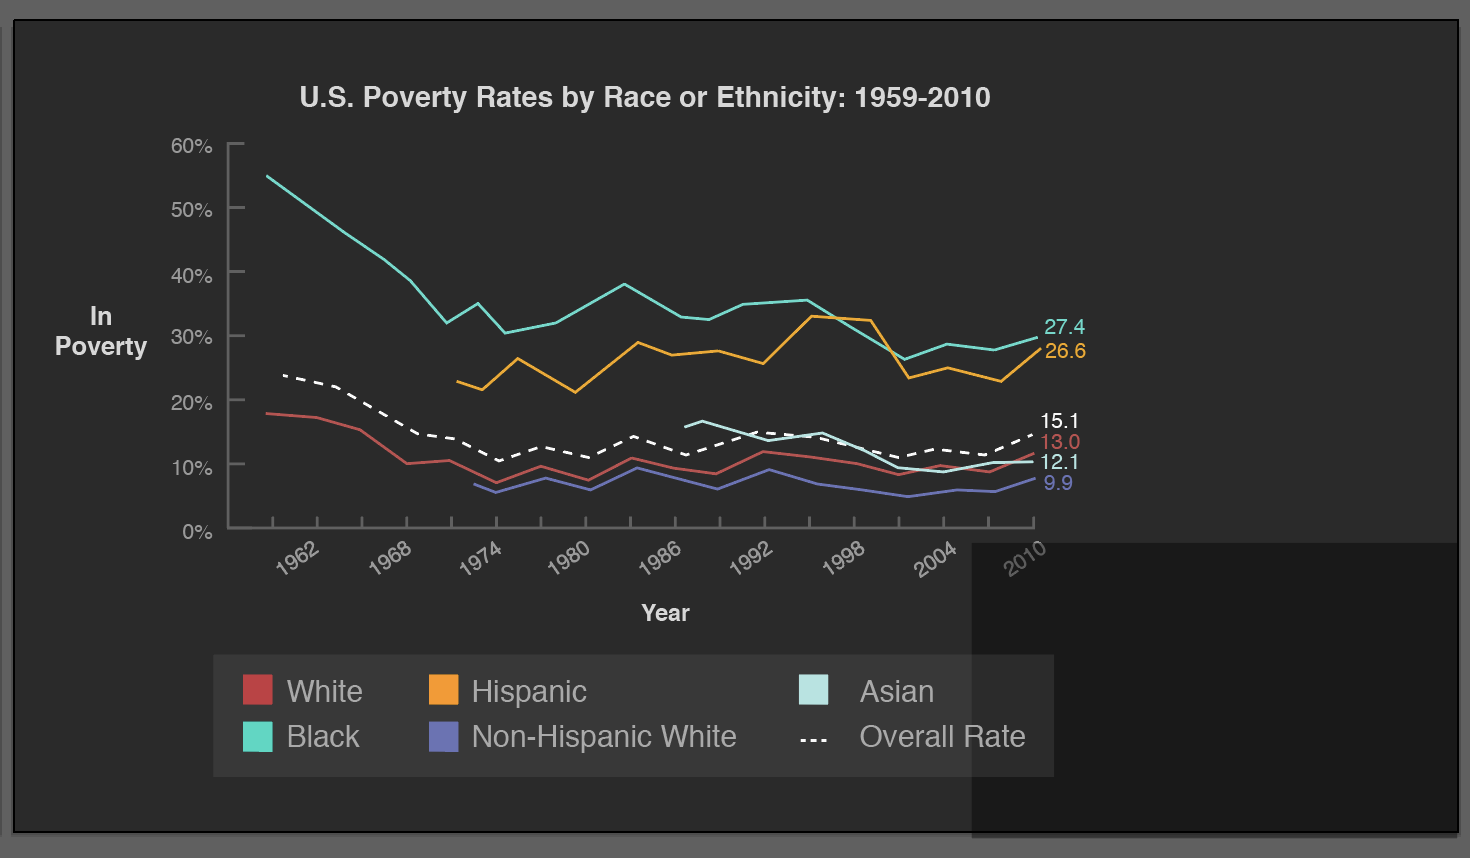
Second iteration, I added a key to the bottom of the page, Maddy suggested to put the key on the right of the graph and organize it by the order each line appears.
Final graph:
Project: AFR303 Intro to Black Studies
Client /Prof: Dr. Gordon, Dr.Colón
completion status: completed
staff guidance/team: Maddy, Abriella, and Rachel
description/plans: redesign graphics for presentation following the style guide
To be completed: Ongoing semester project!
Some new AFR303 graphics I worked on: