Today, I started off the first half of my shift with working on the interactives for the v-lab/e-anthro class. I added more text and added small background shapes to the parts of the interactive where there were thinner strokes. This was done so that the user doesn’t struggle with trying to click the text on the cladogram, and so that the folks who will be putting them into canvasser won’t struggle with working with them. Below is the progress!
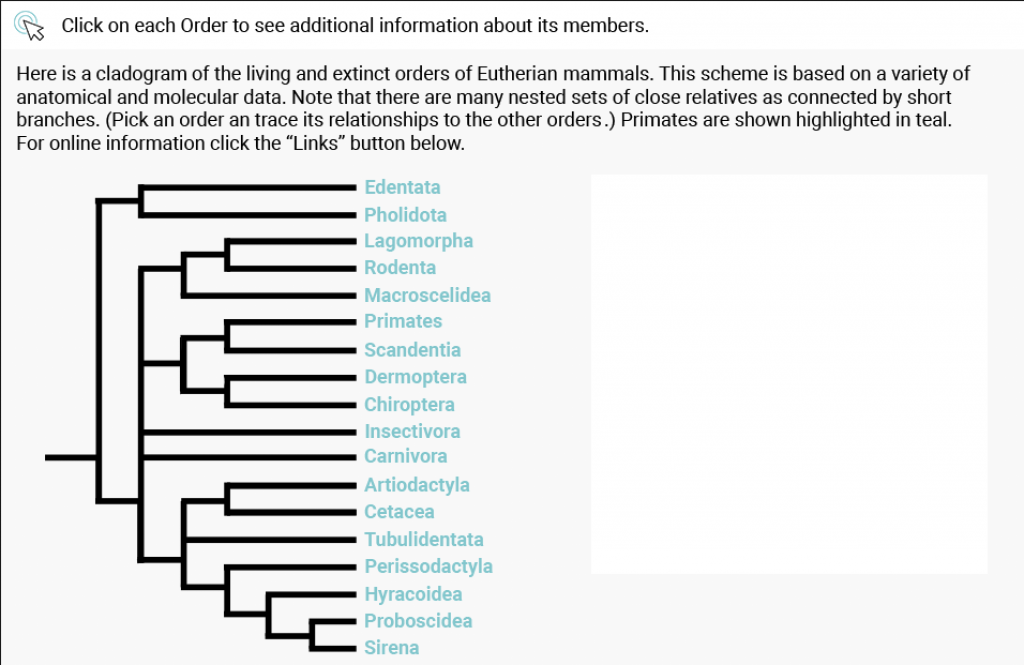
I took out the guides so that you can see the interactive progress more clearly. It looks pretty good so far if I do say so myself. It did take me a while to organize all the layers so that I can easily turn them off and export certain layers into .PNGs for Canvasser.
The second half of my shift was composed of working on the Psychology CE PowerPoint. I was tasked to create and recreate the diagram and graphics for the PowerPoint for this course. They are unable to use these graphics and diagrams because of copyright, so they reached out to us to create, recreate, and/or find public domain graphics.
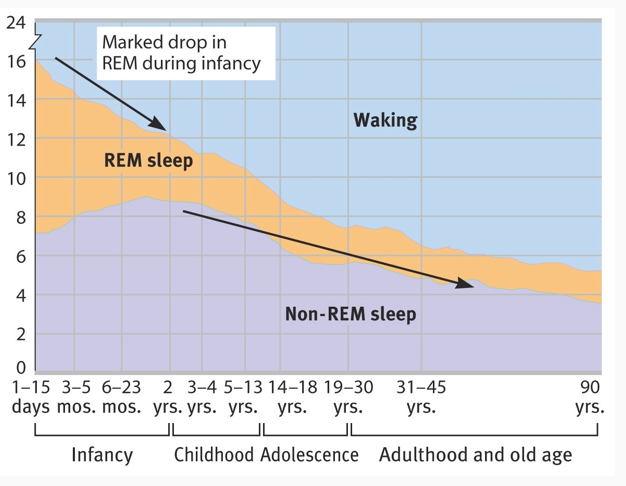
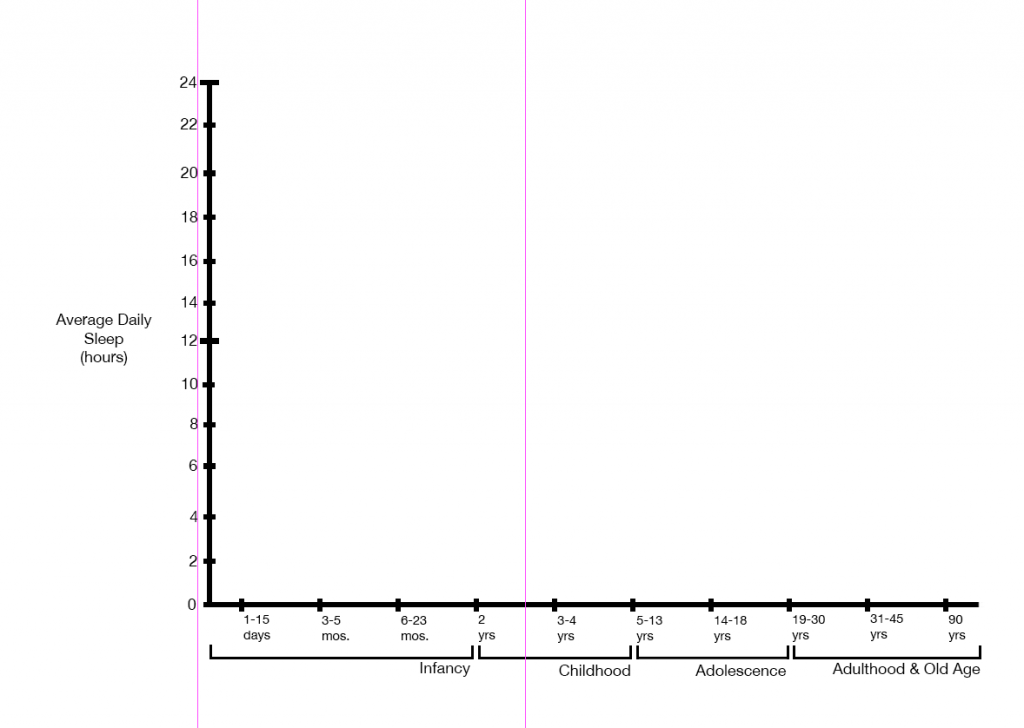
I am currently working on the graph for the 8th slide of the power point. It is a graph that plots average daily sleep against age and developmental stage in order to display a trend between REM sleep, non-REM sleep, and waking hours. Here’s the original graph:
I wanted to see if I could make a different, but similar graph. I wasn’t too keen on the different units of measurements for the age group buckets (days, months, years), and I didn’t know how to feel about the brackets used to delineate the developmental stages.
To start, I brought in the original graph and lowered the opacity of its respective layer. I then turned on the grid and got to work. I sketched a few graph designs on paper (though I’m not sure where those papers went…). I then translated them into Photoshop. These were the concept graphs I made:
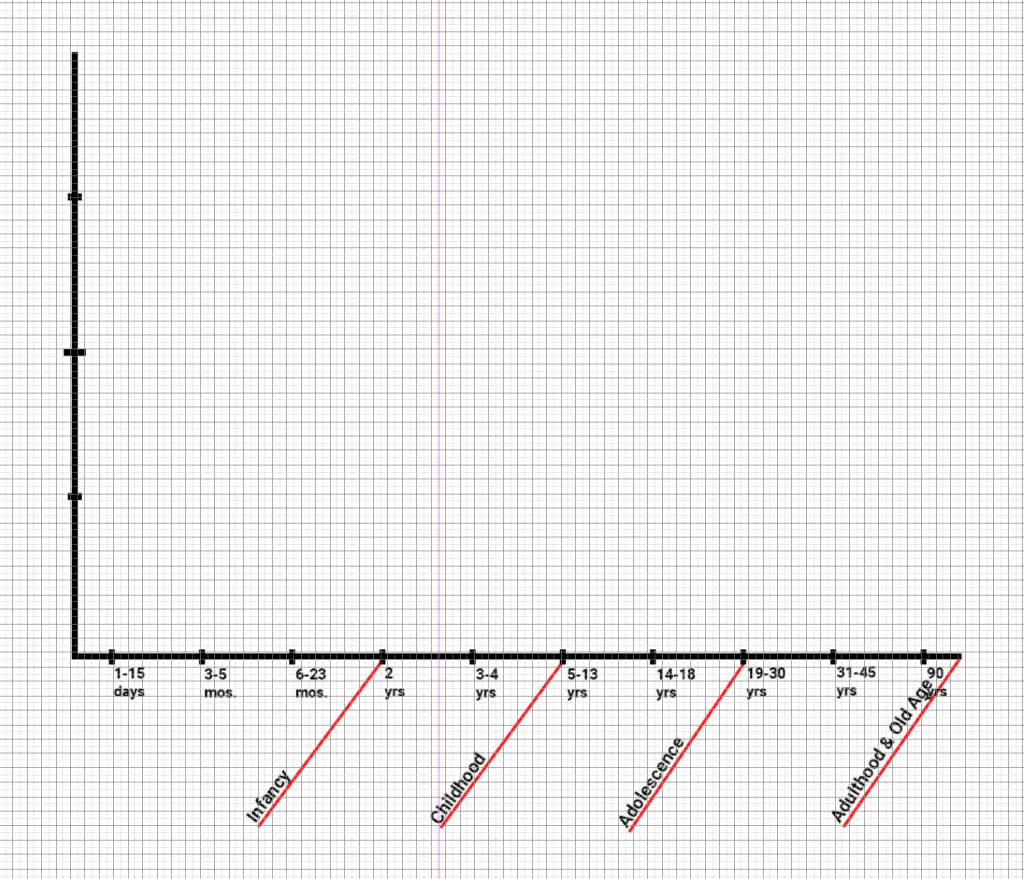
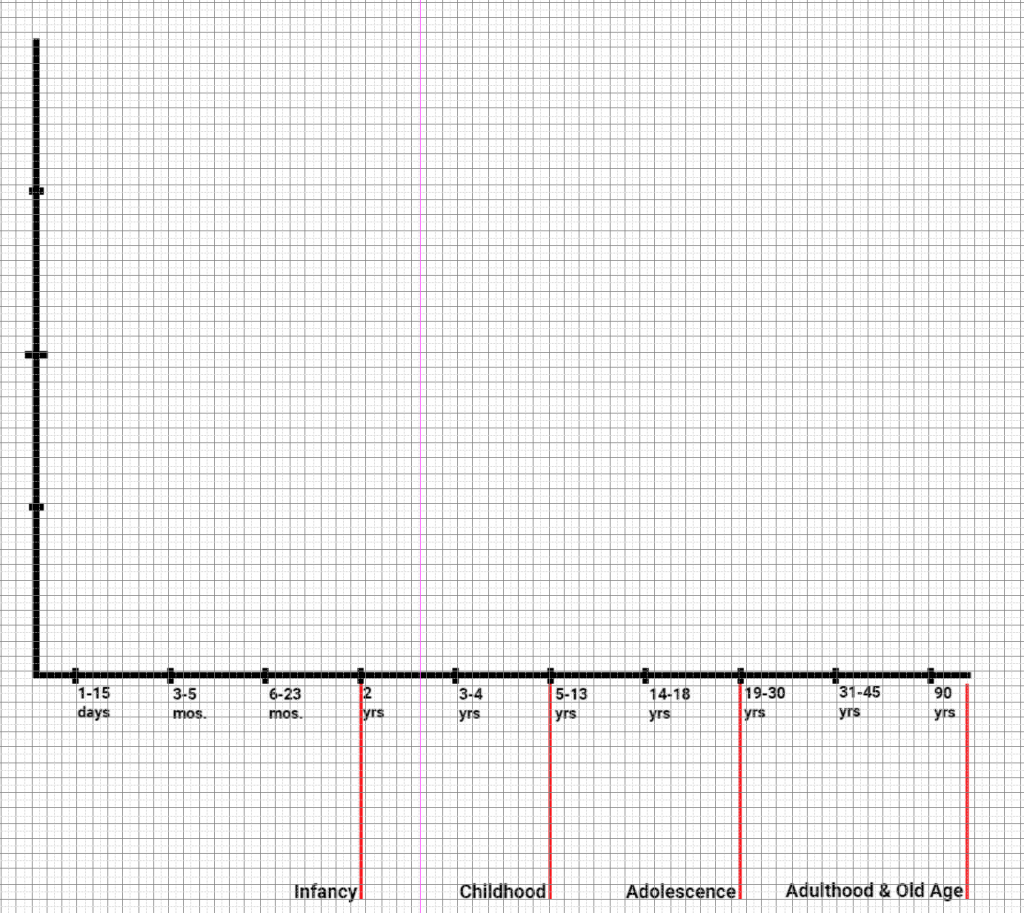
In short, I do not like these concept graphs I came up with. They’re more unclear than the original. I guess don’t fix something if it ain’t broke. So, I scrapped the two ideas/concepts above and started recreating the original graph.
That’s all I did for this shift. More to come on Friday!