• We are STAs
    • Abriella Corker
    • Adrian McKee
    • Cristina Villarreal Núñez
    • Hoa Truong
    • Ingrid Alberding
    • Keshav Thamalia
    • Marianne Le
    • Rachel Sacks
    • Sheryl Long
    • Thuy Nguyen
  • We were STAs
  • STA Presentation
    • STA Presentation 2017
    • STA Presentation 2016
  • Testimonials
  • Resources
  • Home

STA Blog

GG Plot Visualizations

March 8, 2018 By Jaclyn Alford

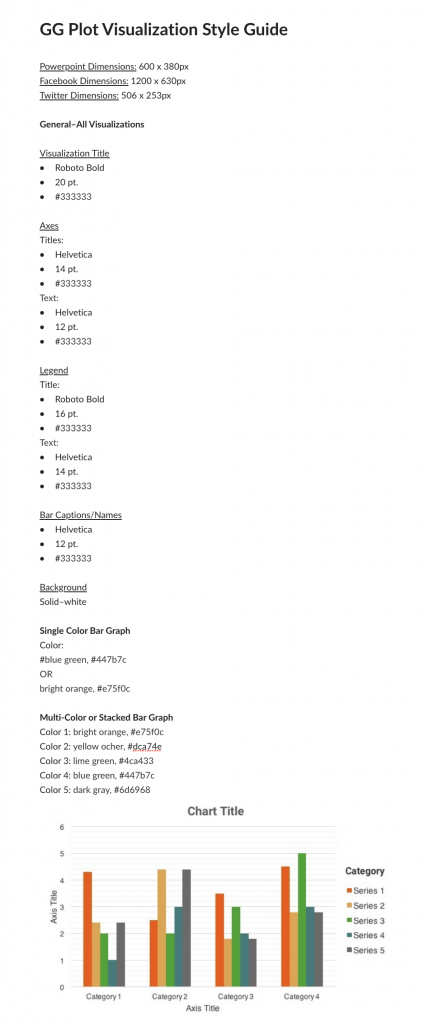
I started working on a visualization project for the Dev. Studio using GG Plot. Thus far, learning GG Plot has consisted of a lot of trial and error. First, I developed a style guide outlining font families, font sizes, font faces, text color, background color, and bar colors.

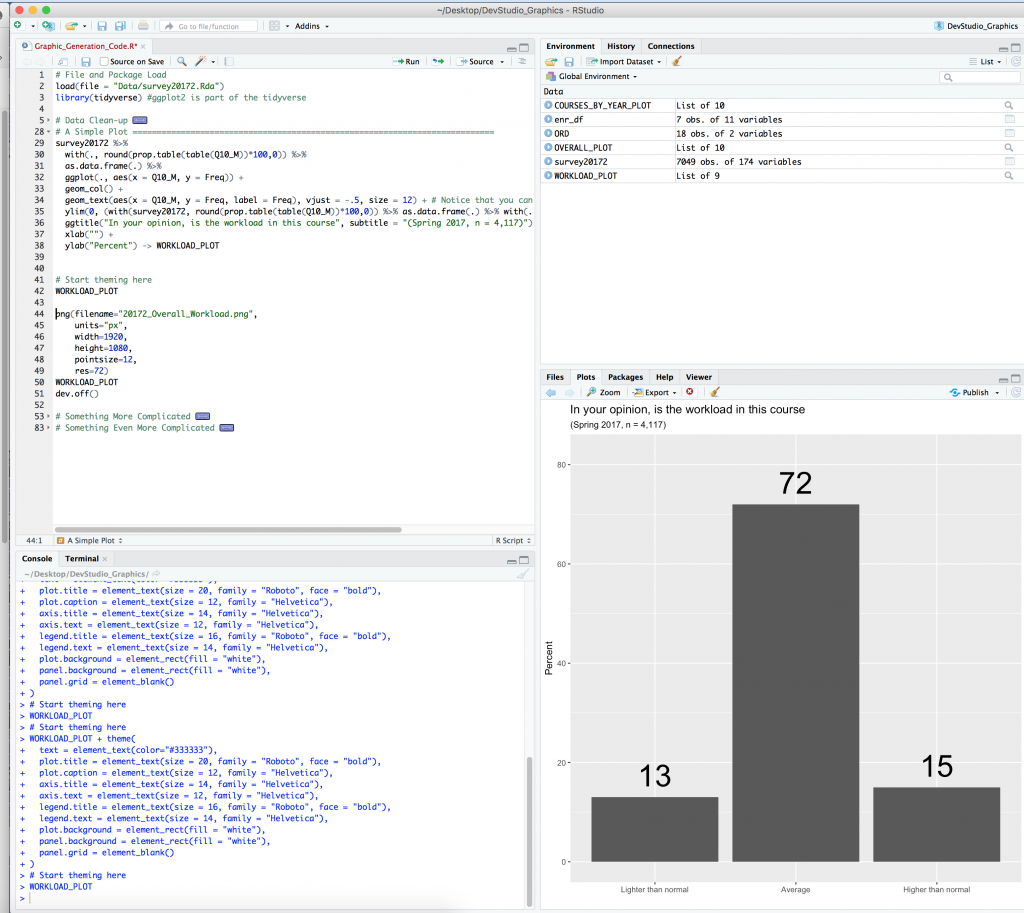
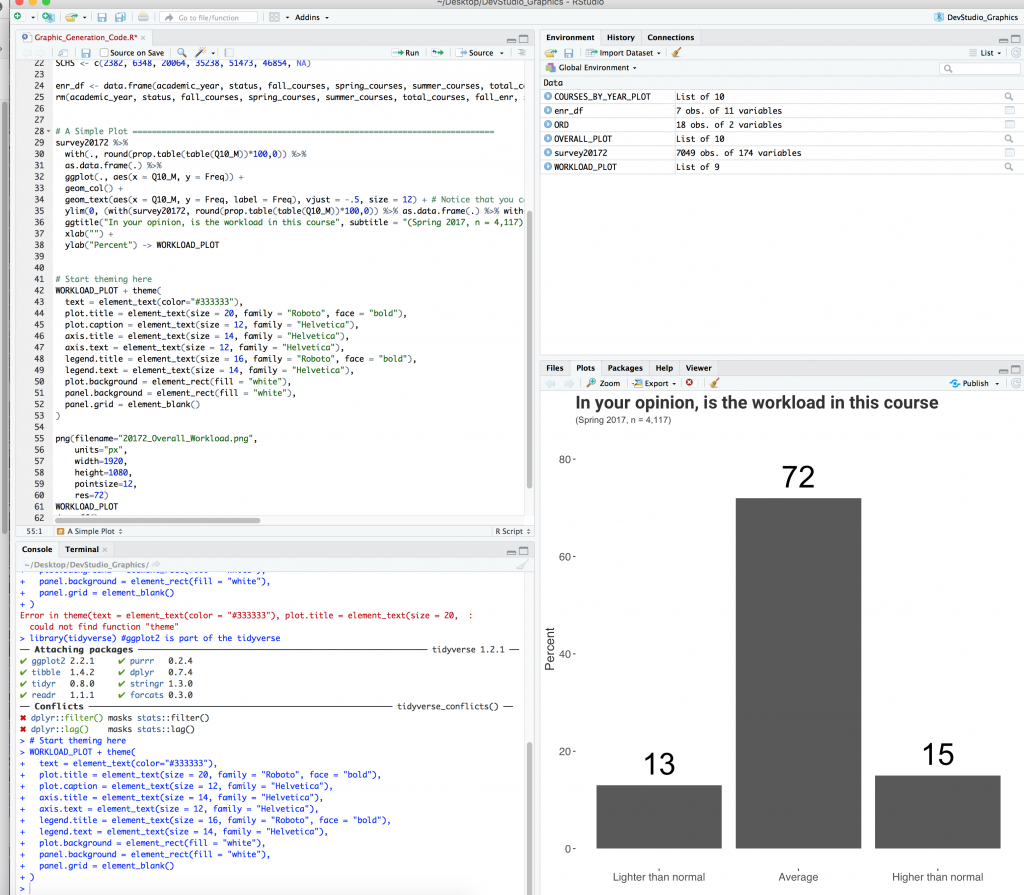
For one visualization, I have successfully changes the fonts and background to match the style guide using this block of code (which can then be copy+pasted to make any visualization adhere to this font and bg style):

_________________________________
# Start theming here
WORKLOAD_PLOT + theme(
  text = element_text(color=”#333333″),
  plot.title = element_text(size = 20, family = “Roboto”, face = “bold”),
  plot.caption = element_text(size = 12, family = “Helvetica”),
  axis.title = element_text(size = 14, family = “Helvetica”),
  axis.text = element_text(size = 12, family = “Helvetica”),
  legend.title = element_text(size = 16, family = “Roboto”, face = “bold”),
  legend.text = element_text(size = 14, family = “Helvetica”),
  plot.background = element_rect(fill = “white”),
  panel.background = element_rect(fill = “white”),
  panel.grid = element_blank()
)
__________________________________

Original:

Updated:

Filed Under: 2017-2018

link to LAITS home page

Video STA Home

© 2022 Liberal Arts Instructional Technology Services | Production Credits