• We are STAs
    • Asha Rountree
    • Haley Ma
    • Kate Shih
    • Kyra Lee
    • Nicholas Peasley
    • Sasha Kenney
    • Shanda Horm
    • Shriya Atreya
    • Tomas Marulanda-Mesa
  • We were STAs
  • STA Presentation
    • STA Presentation 2017
    • STA Presentation 2016
  • Testimonials
  • Resources
  • Home

STA Blog

STA Work Blog

STAs: Student Technology Assistants

Who We Are
LAITS: IT and Facilities Director, Joe TenBarge initiated the Student Technology Assistant program in 2004. STAs are UT students who work on a variety of projects in collaboration with UT faculty and LAITS staff members. STAs assist College of Liberal Arts faculty members and administrative staff with print and web design. From building presentations, to creating audio/visual works, and producing online classes in the LAITS film studios, STAs are instrumental in helping COLA faculty realize their vision for multimedia projects that enhance their teaching and the students learning experience. By the end of their student careers, STAs have portfolios which demonstrate their accrued technical and design skills.


Prospective STAs:

Creative and technically inclined students are appointed as STAs for one year, with the possibility of being rehired as long as they study at the university. Applicants for the program are hired before both long semesters. Interested students may look for postings on Hire-A-Longhorn when positions are available. Positions will have Student Technology Assistant (illustrator or web designer) in the title of the job post.


Faculty and Staff:

Faculty & Staff with questions about services, please contact us.

https://liberalarts.utexas.edu/laits/contacts.php

  • Audio Services: Michael C Heidenreich, Director of Studio Operations & STA Program Coordinator
  • Video Services: Kelly Webster, Video Production Supervisor, Video STA Supervisor
  • Graphic Design & Web Design Services: Suloni Robertson, Art Director / Design & Coding STA Supervisor

2-18-19

February 18, 2019 By Olivia Wilczek

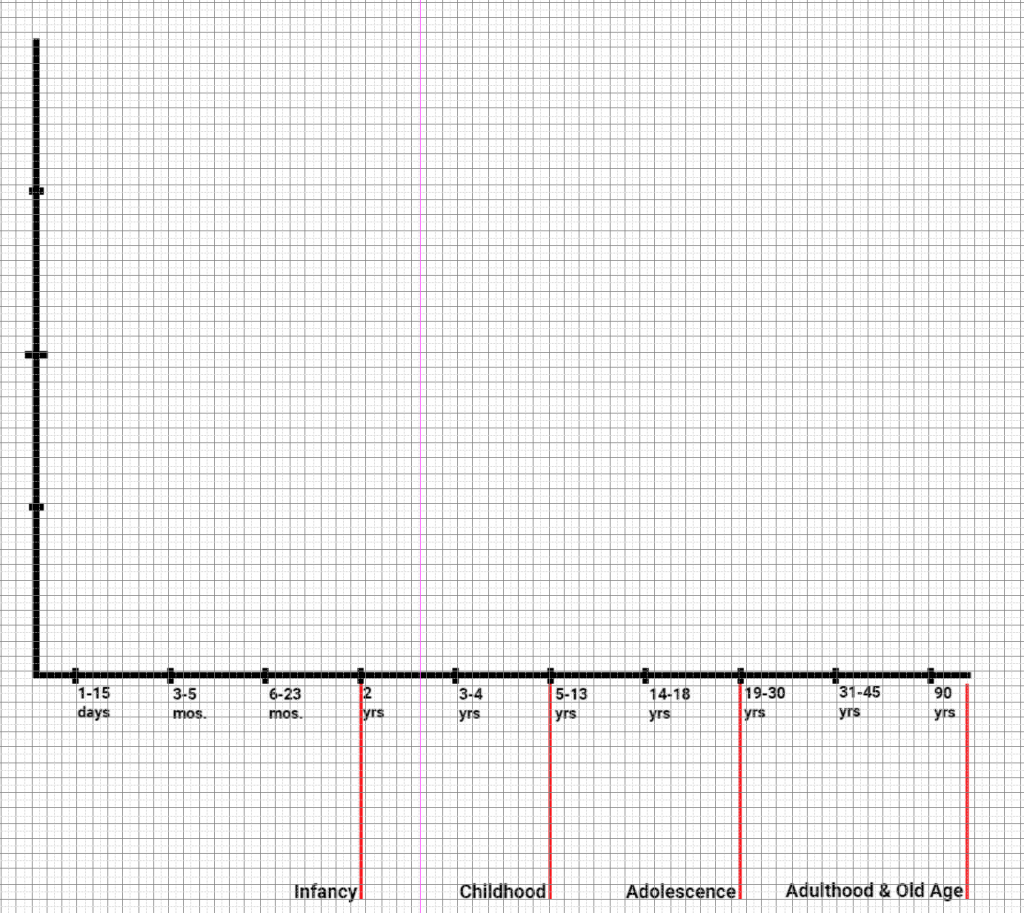
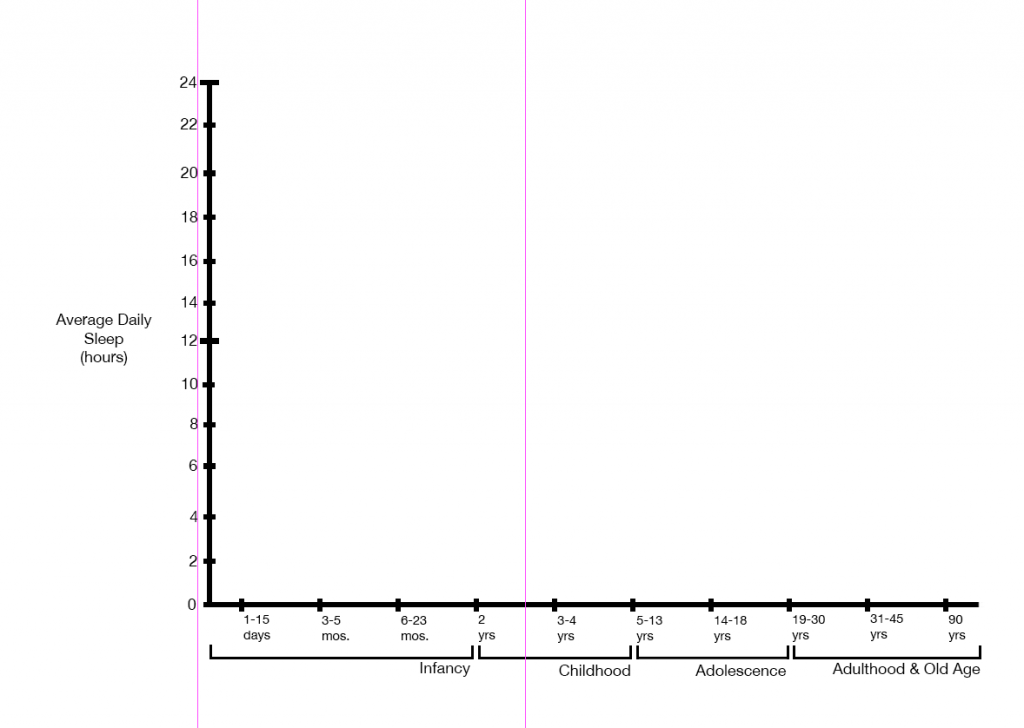
Last week & this Monday I learned how to use Canvasser to create interactives.

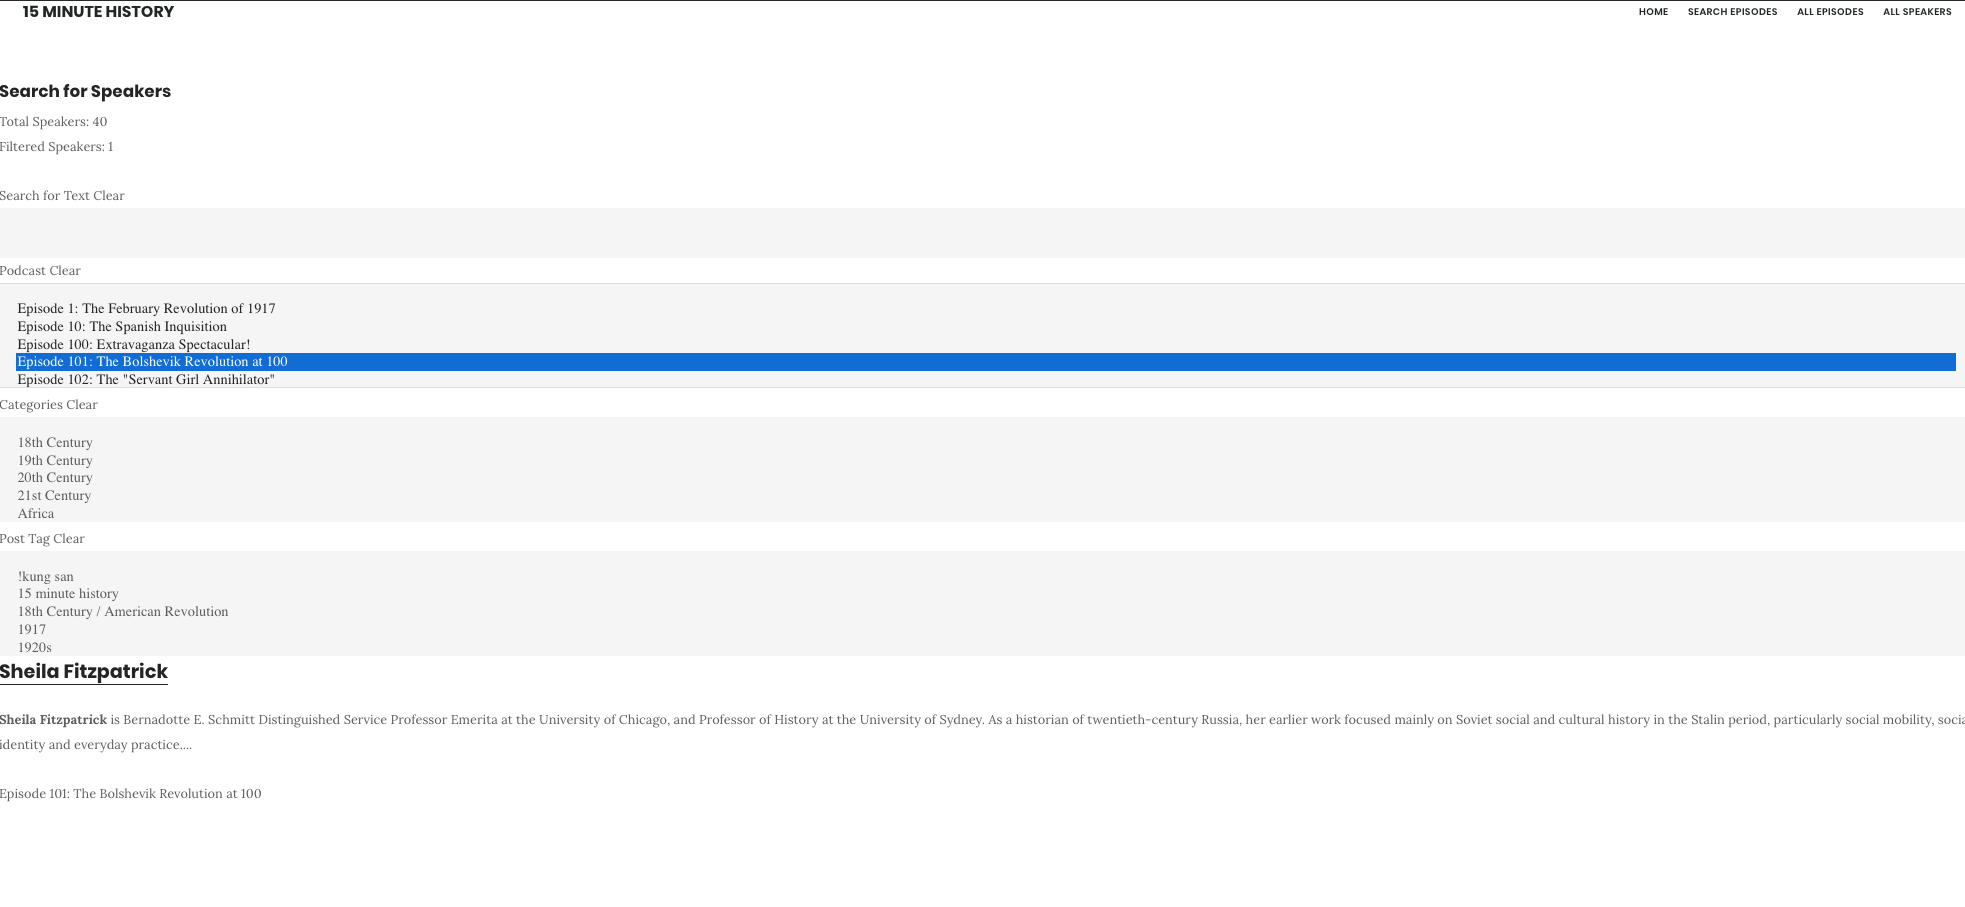
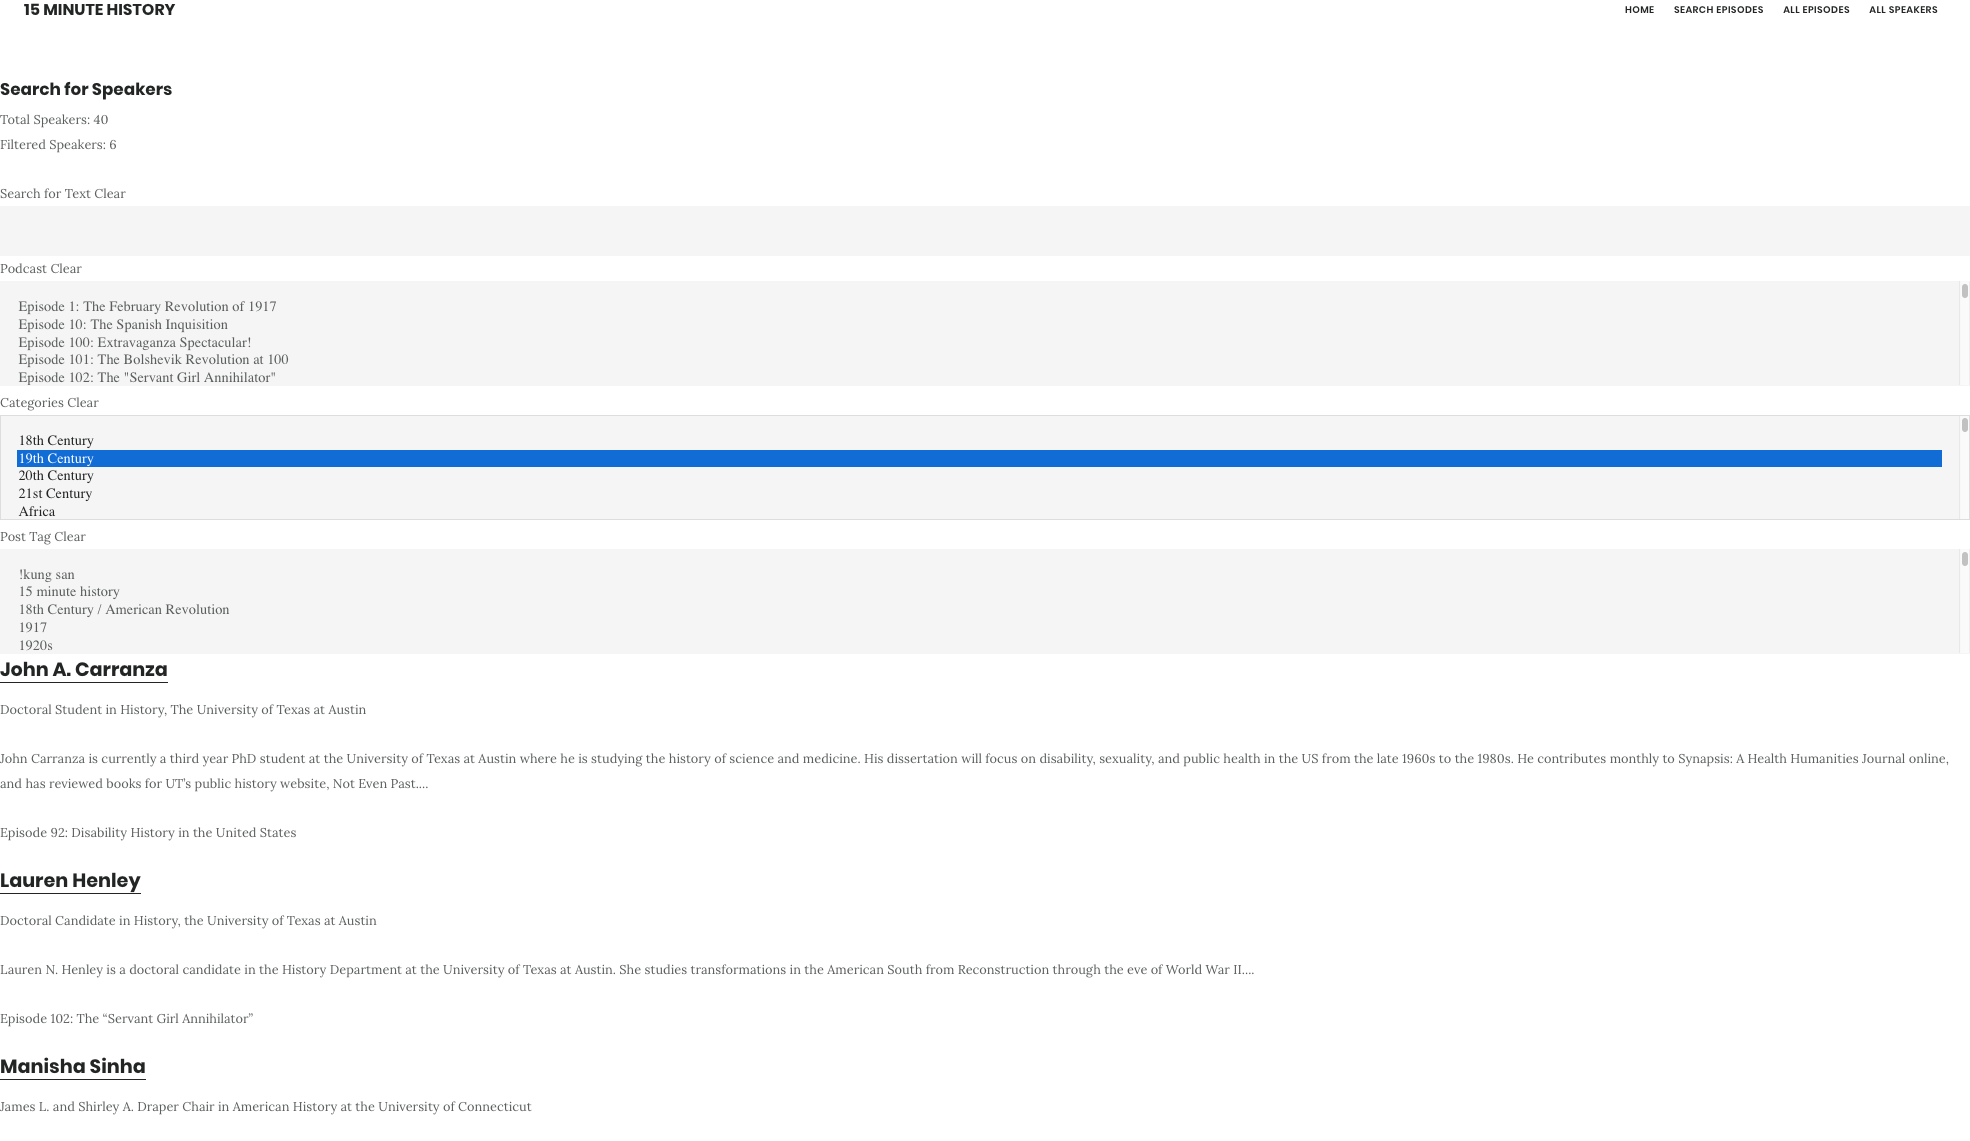
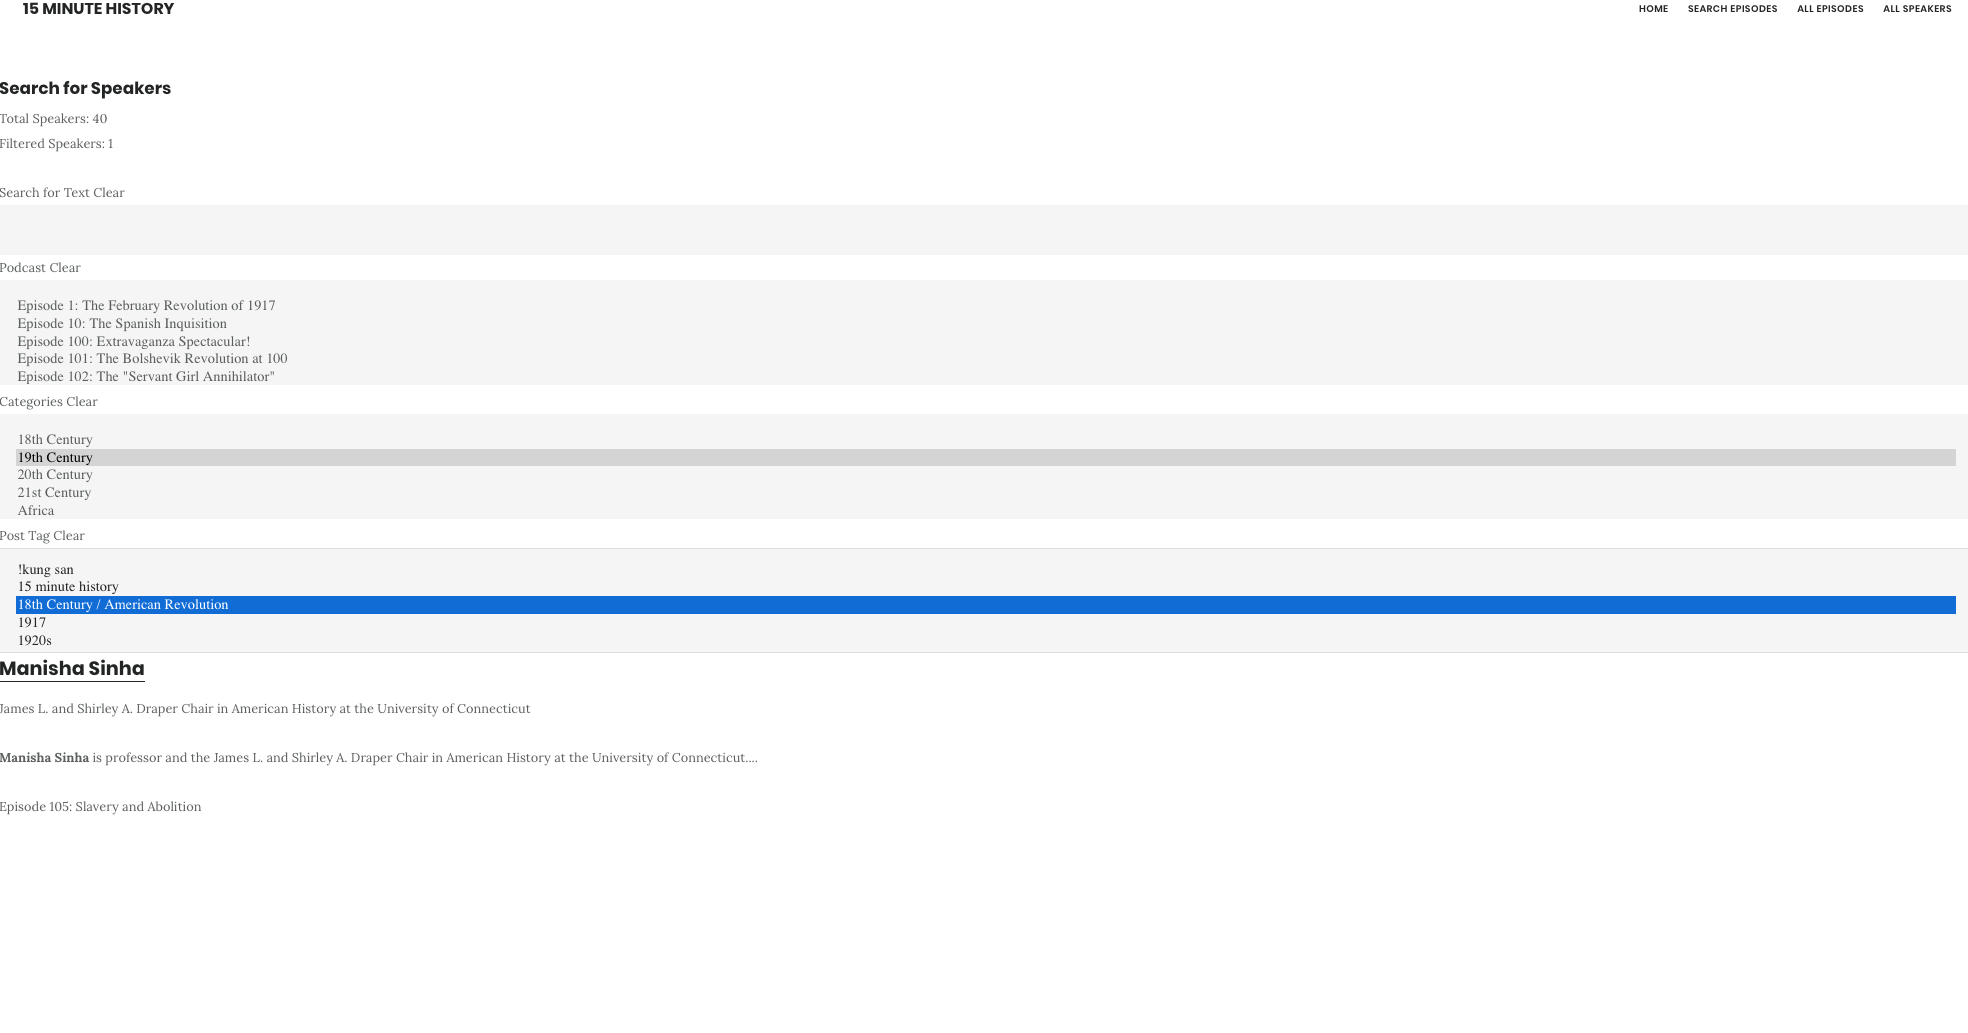
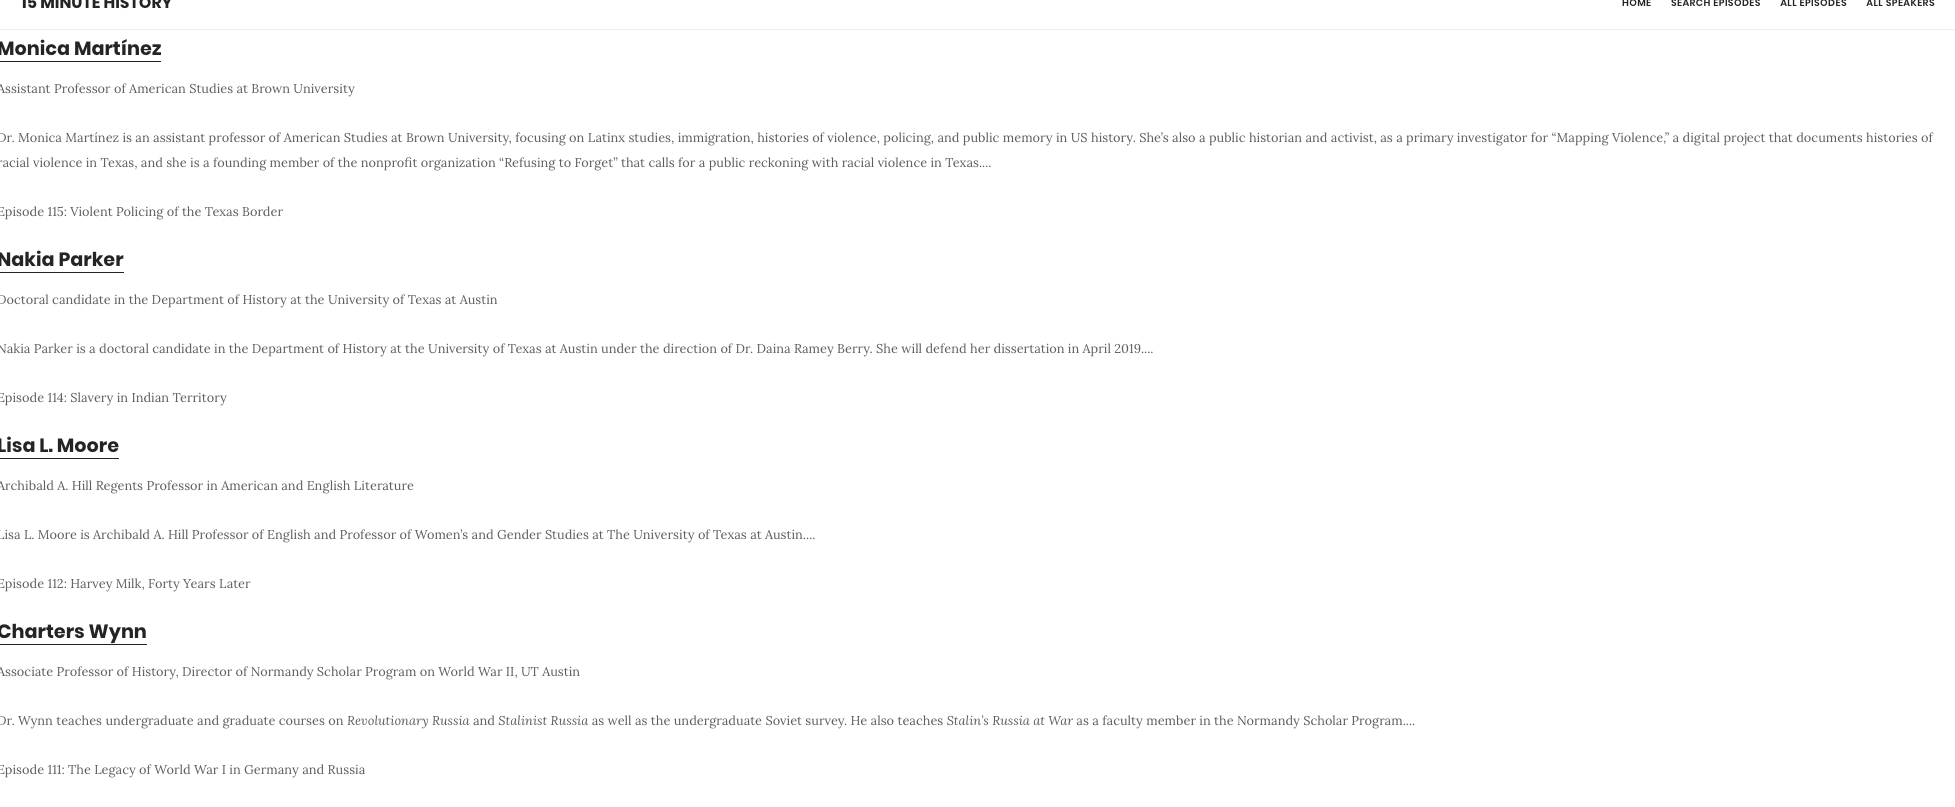
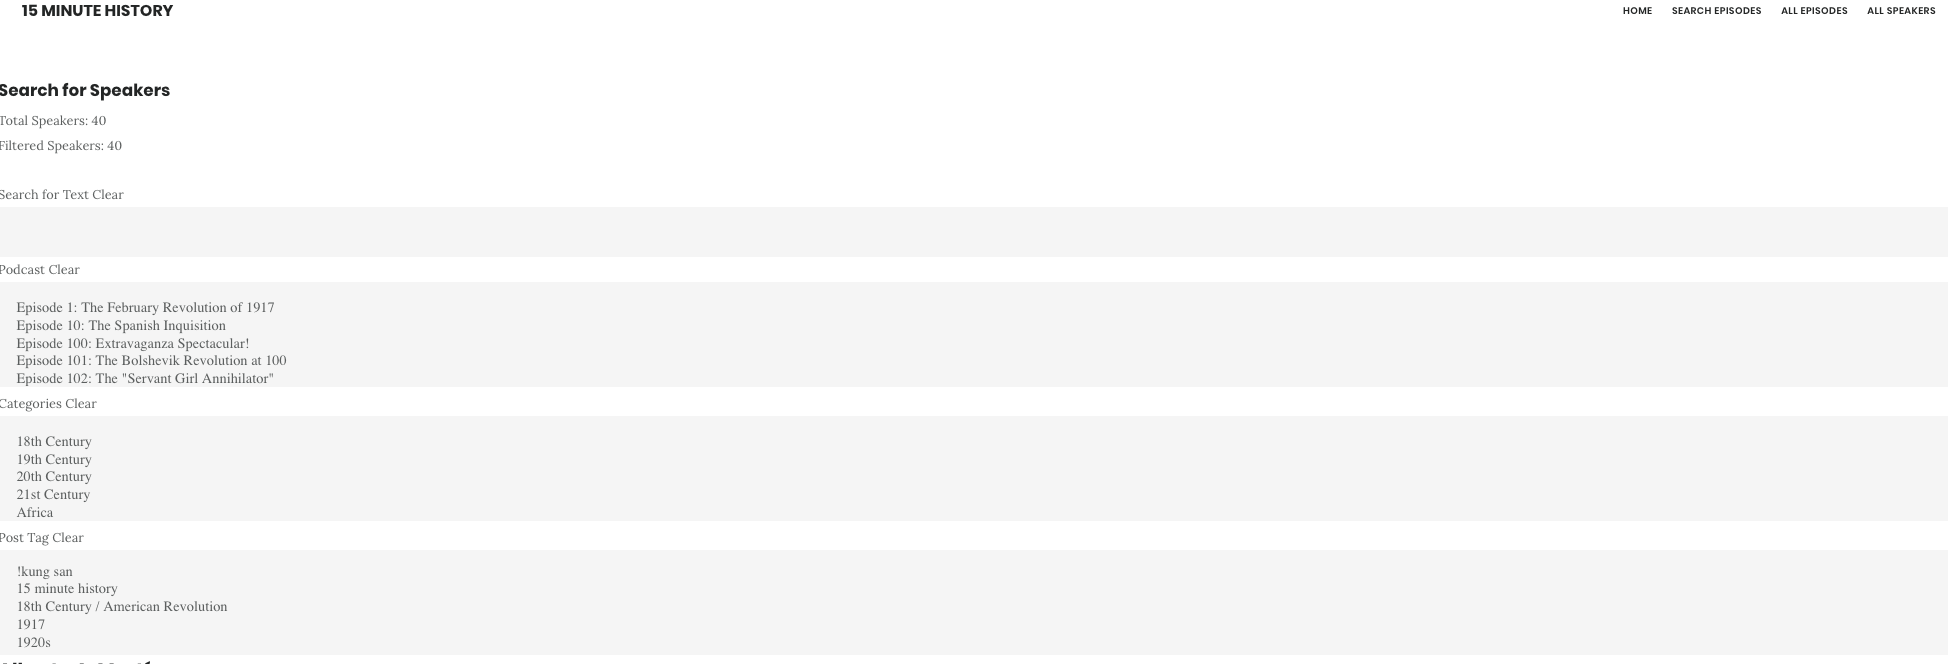
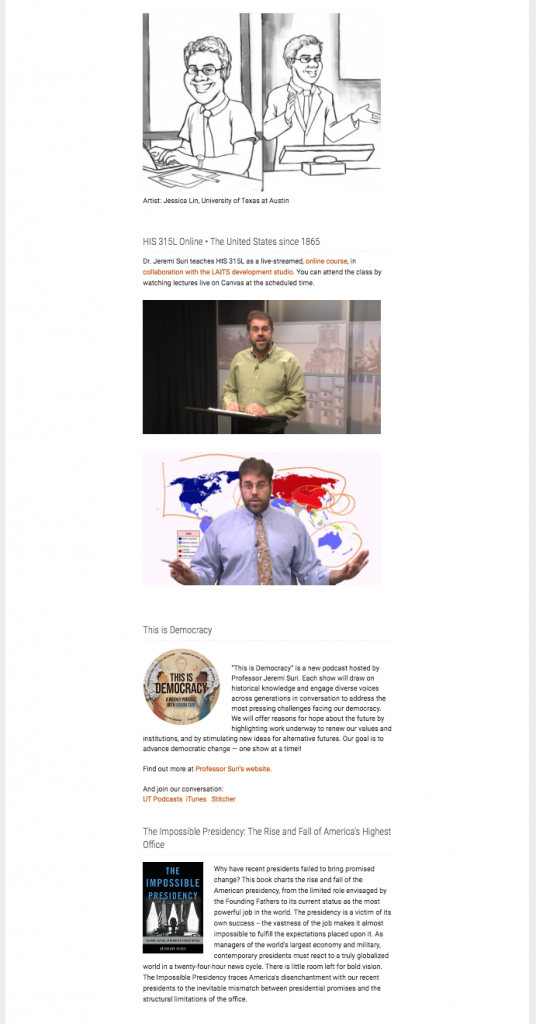
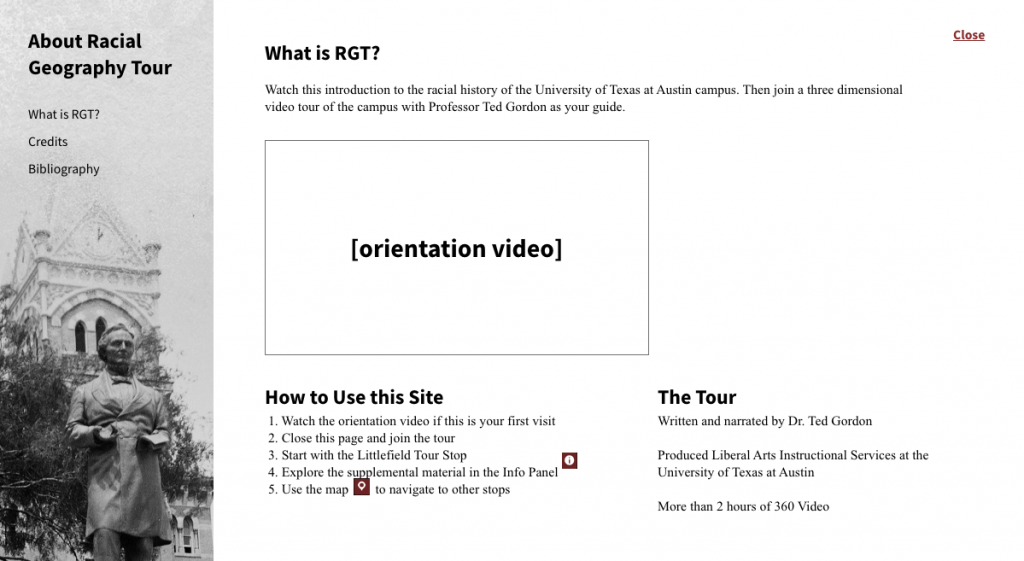
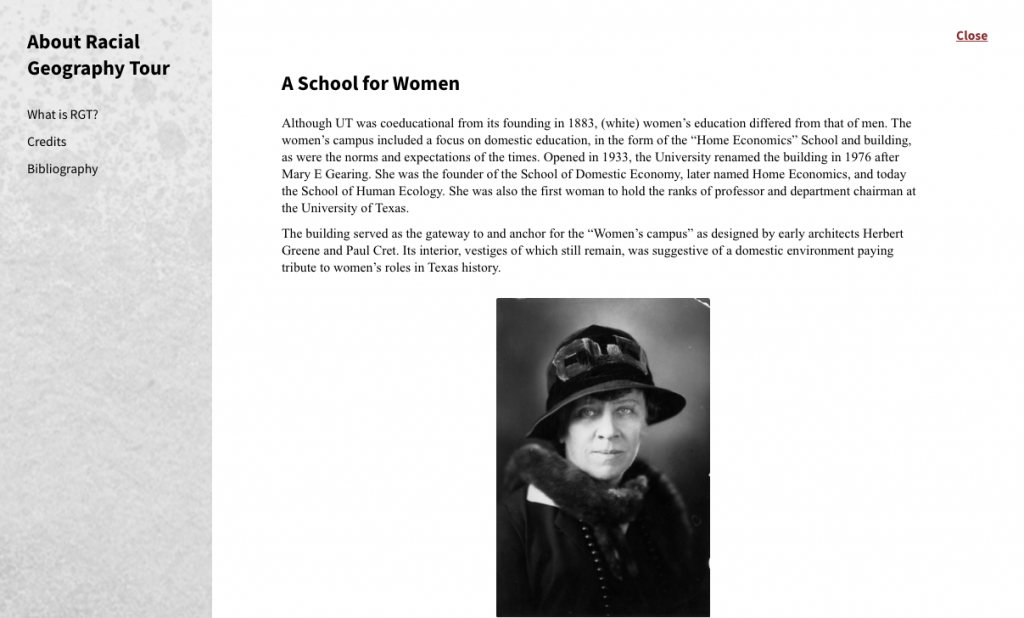
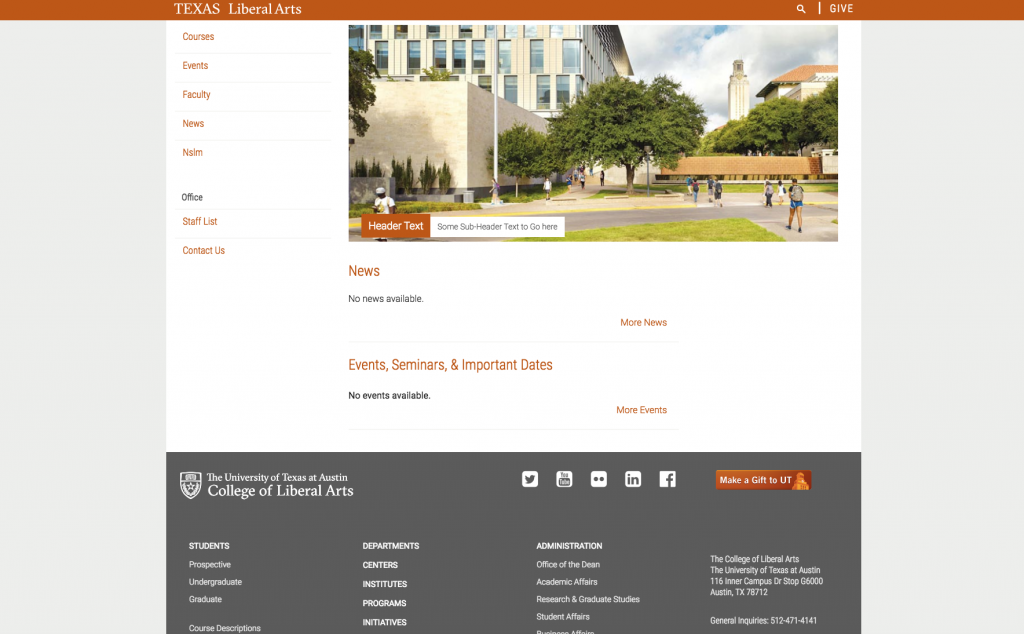
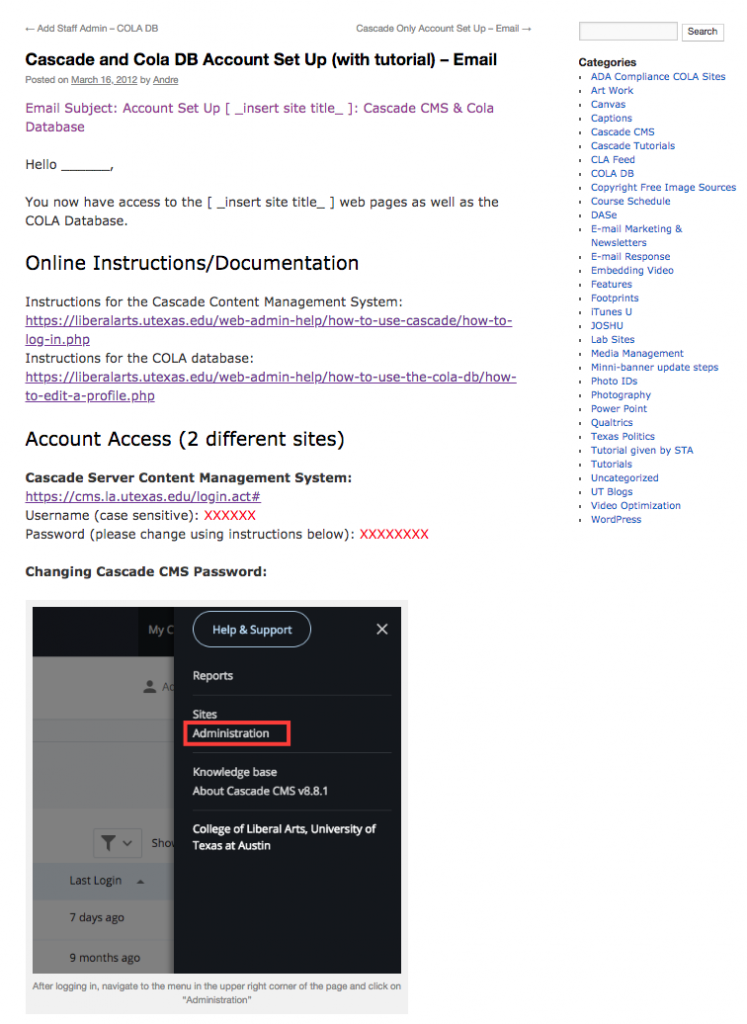
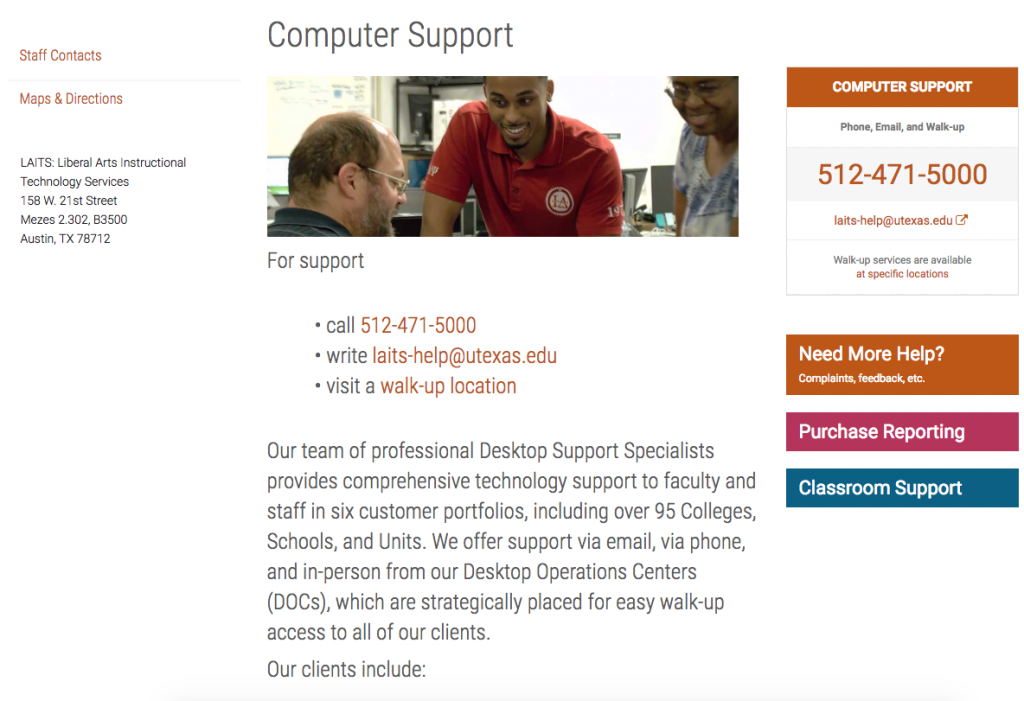
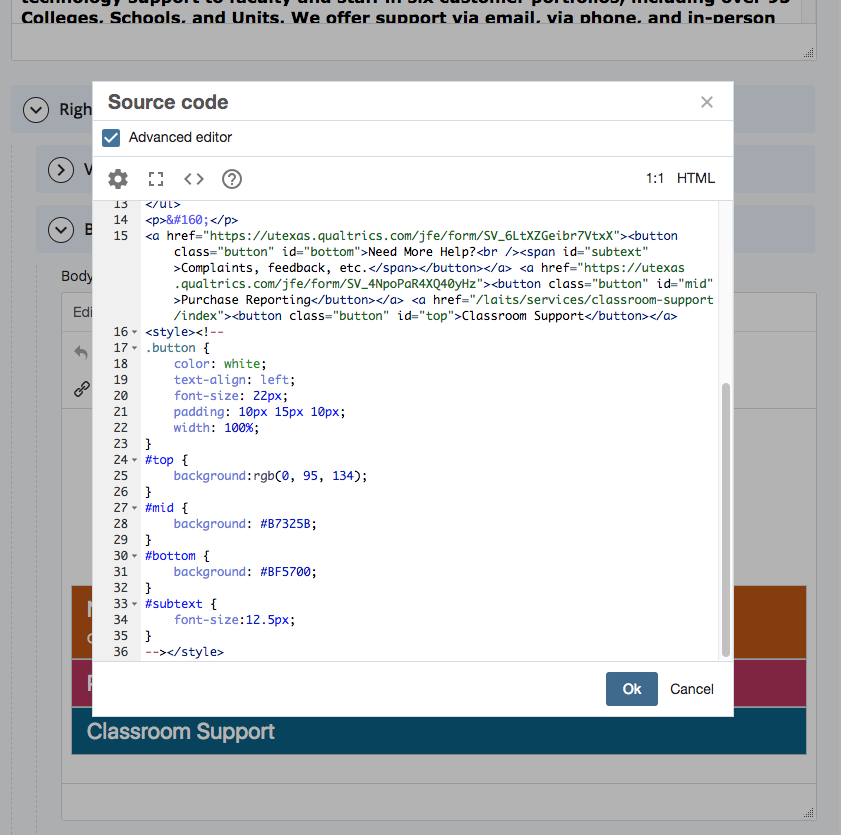
I also got a PHP overview from Stacy and started applying CSS to the 15 Minute History Podcast websites to reflect my mockups. Here are the initial changes!

Episode Page
Speaker Page
Speaker Search Page

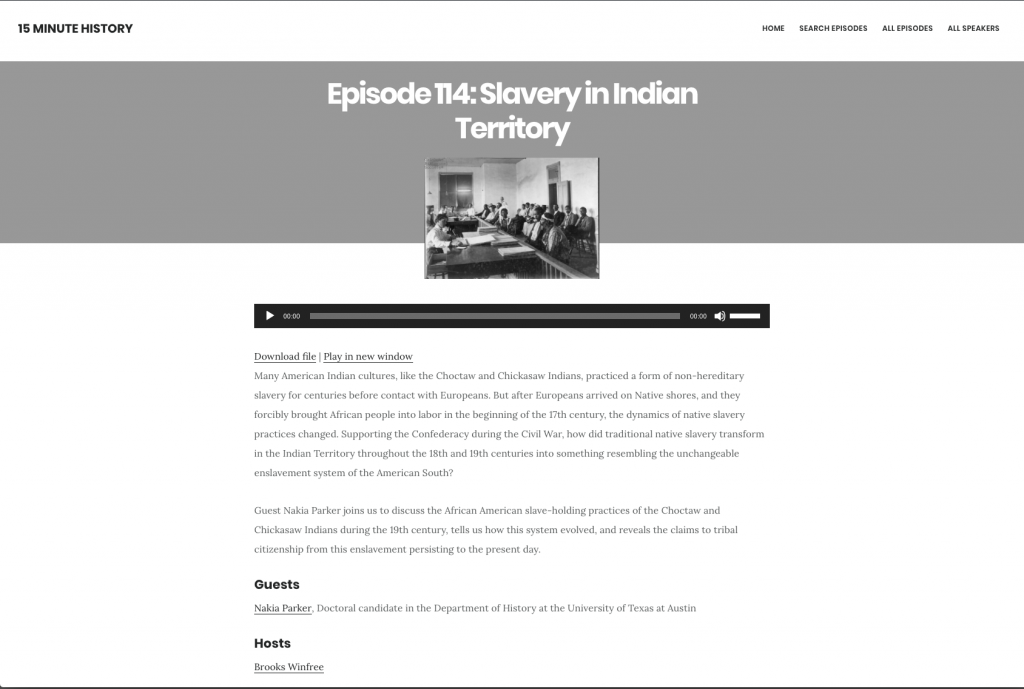
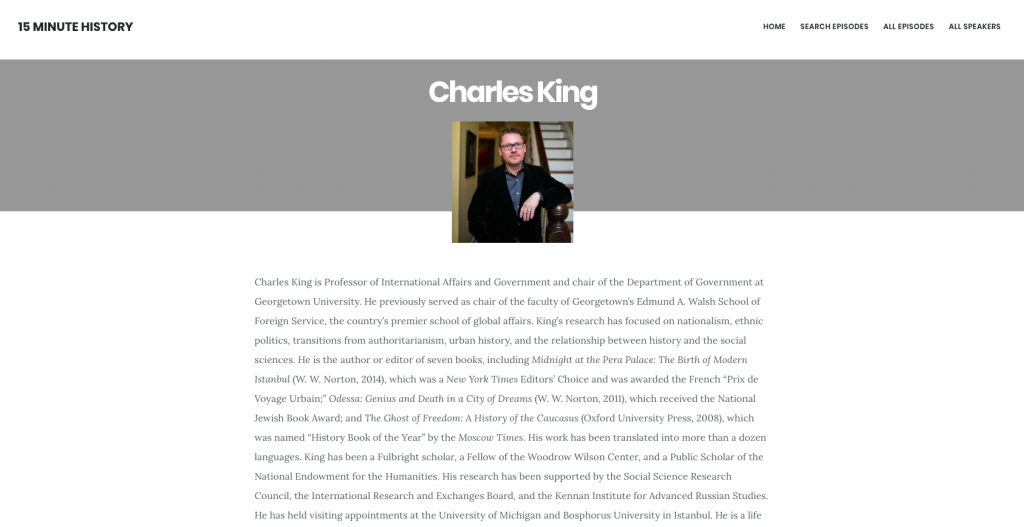
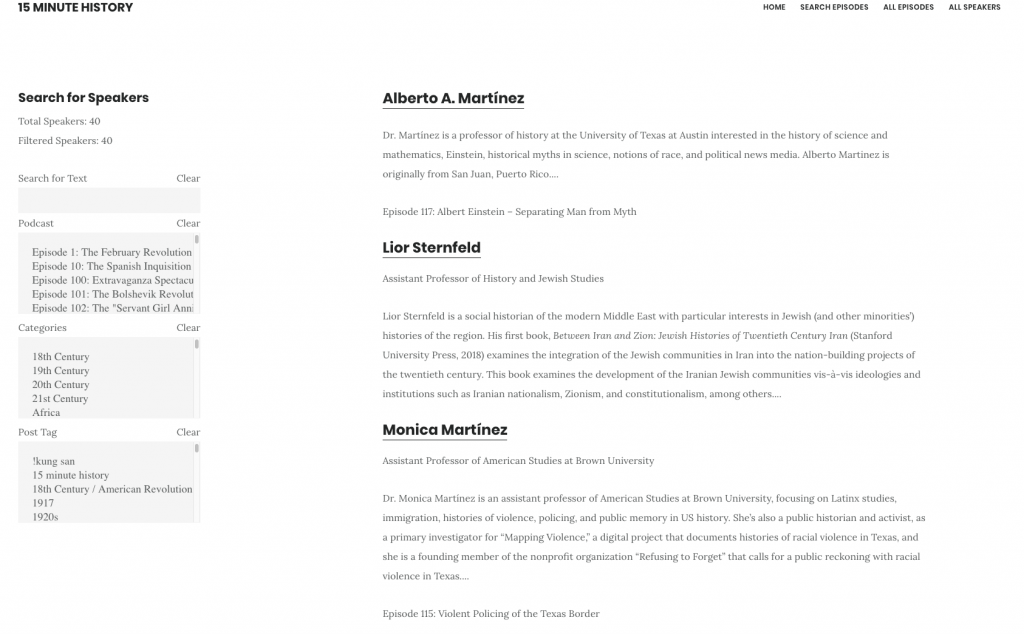
Still a lot of changes to come but the pages are starting to look more uniform.

Filed Under: 2018 Fall - 2019 Spring

Speaker is done

February 18, 2019 By Clarissa Miranda

Today I finished the filtering by podcast name, tag and category. Dates were taken off of the panel, and also I was able to display the speaker with the episodes they participated in.

Filtered by podcast episode
Filtered by category
Filtered by category and tag
Episodes for each speaker now displaying
Dates panel was delete

Filed Under: 2018 Fall - 2019 Spring

2-18-19

February 18, 2019 By Bridget

Filed Under: 2018 Fall - 2019 Spring

A Break from the Usual

February 18, 2019 By Estella Sun

I took a break from Vlabs and Theatre of Philosophy this week to work on some other more urgent projects that came up.

First was Racial Geography tour. I joined Suloni and Stacy in their meeting with the Liberal Arts PR team and clients. There, Stacy demonstrated what was completed on the website and they talked about plans for launch. Listening in was a really good way to learn more about the project.

After we got back, I was assigned to make some mockups for the remaining un-styled parts of the site for Stacy.

Home Page that includes introductory info, instructions, and an orientation video.
Supplementary info popup
RGT_mockups_Feb 2Download
RGT_mockups_FebDownload

After RGT was done I worked on mostly cascade things. First I created the web presence for ISLD.

And I edited some articles in the STA knowledge base.

Finally, I worked on implementing a custom css bit onto the LAITS website: https://liberalarts.utexas.edu/laits/services/computer-support/index.php

This assignment was actually given to me before Andre left. I had written some code for him to implement using his special permissions, but he left before finishing.

Filed Under: 2018 Fall - 2019 Spring

More Psych CE stufffff

February 18, 2019 By Valerie Tran

A lot of my time spent making this graph was mostly organizing my many layers. I wanted to ensure that if a change was necessary, it would be easy for the user who has access to the .psd file. Here’s what the graph looks like currently:

Changed up the color scheme

And here are all the layers I organized..

And here’s what they look like collapsed into their respective groups.

So compressed!!!

This will definitely be done on Monday and I will start on another graph/diagram then! That’s all for this shift 🙂

Filed Under: 2018 Fall - 2019 Spring

v-lab interactive & Psych CE

February 18, 2019 By Valerie Tran

Today, I started off the first half of my shift with working on the interactives for the v-lab/e-anthro class. I added more text and added small background shapes to the parts of the interactive where there were thinner strokes. This was done so that the user doesn’t struggle with trying to click the text on the cladogram, and so that the folks who will be putting them into canvasser won’t struggle with working with them. Below is the progress!

I took out the guides so that you can see the interactive progress more clearly. It looks pretty good so far if I do say so myself. It did take me a while to organize all the layers so that I can easily turn them off and export certain layers into .PNGs for Canvasser.

The second half of my shift was composed of working on the Psychology CE PowerPoint. I was tasked to create and recreate the diagram and graphics for the PowerPoint for this course. They are unable to use these graphics and diagrams because of copyright, so they reached out to us to create, recreate, and/or find public domain graphics.

I am currently working on the graph for the 8th slide of the power point. It is a graph that plots average daily sleep against age and developmental stage in order to display a trend between REM sleep, non-REM sleep, and waking hours. Here’s the original graph:

look at dat graph

I wanted to see if I could make a different, but similar graph. I wasn’t too keen on the different units of measurements for the age group buckets (days, months, years), and I didn’t know how to feel about the brackets used to delineate the developmental stages.

To start, I brought in the original graph and lowered the opacity of its respective layer. I then turned on the grid and got to work. I sketched a few graph designs on paper (though I’m not sure where those papers went…). I then translated them into Photoshop. These were the concept graphs I made:

Graph with slanted developmental stage categories
Graph with vertical developmental stage categories

In short, I do not like these concept graphs I came up with. They’re more unclear than the original. I guess don’t fix something if it ain’t broke. So, I scrapped the two ideas/concepts above and started recreating the original graph.

Looks familiar, huh?

That’s all I did for this shift. More to come on Friday!

Filed Under: 2018 Fall - 2019 Spring

  • « Previous Page
  • 1
  • …
  • 22
  • 23
  • 24
  • 25
  • 26
  • …
  • 62
  • Next Page »

link to LAITS home page

Video STA Home

© 2025 Liberal Arts Instructional Technology Services | Production Credits