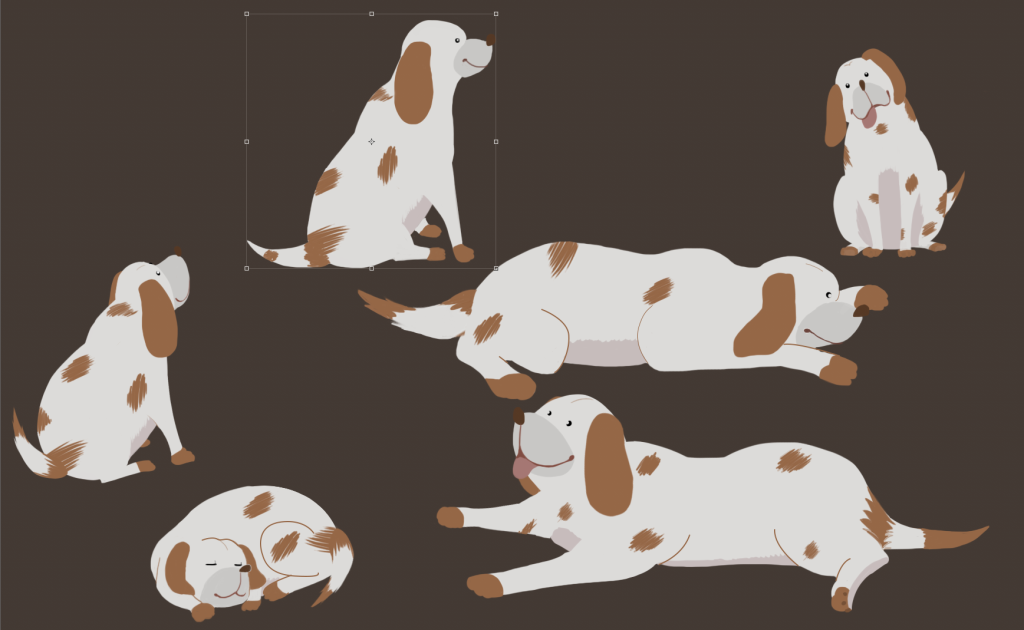
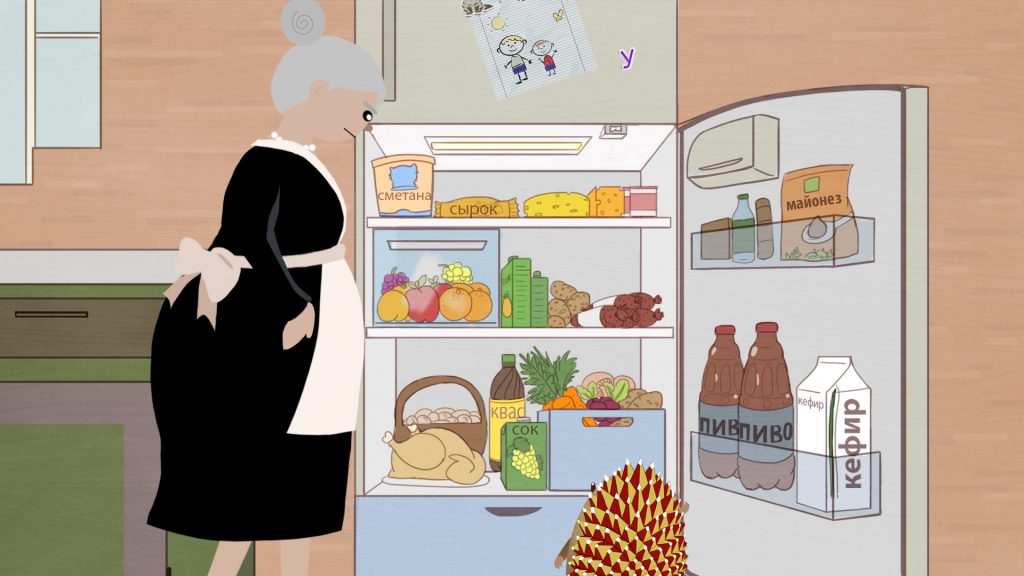
Here is a RUS illustration I did the coloring for. (Valerie did the line work.) This was really nice to do, and was honestly a nice if short relaxing break from doing animations.
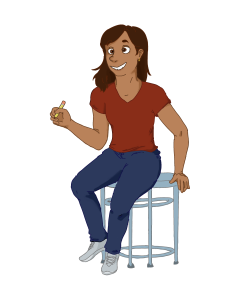
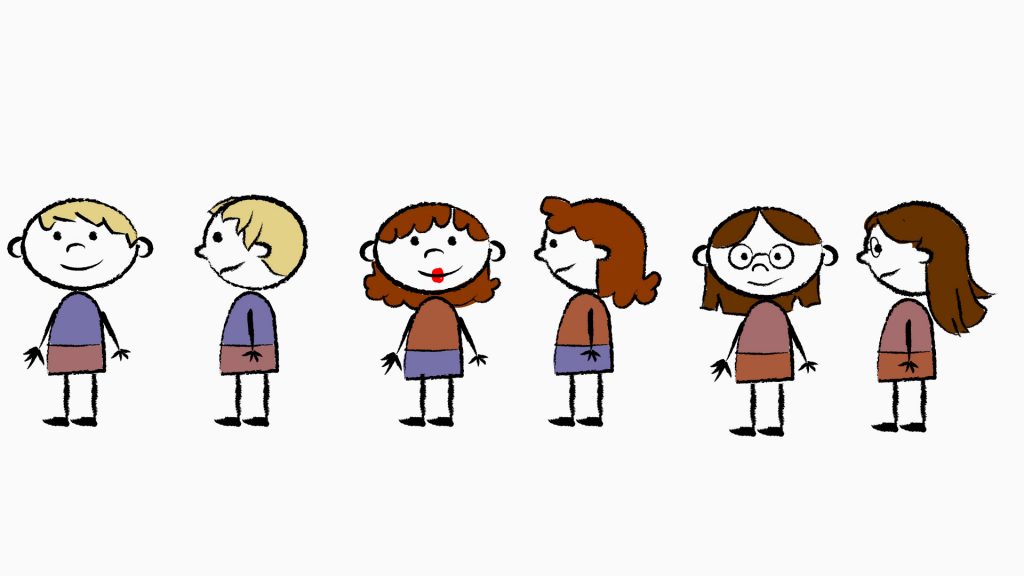
Here is one of the visuals I submitted for the STA interview video. I just made a few characters in the style of what would be shown in the RUS simple animations. The interview was fun to do, and I got to sit in a room where people put me under bright lights and asked questions. It was fun when I wasn’t nervous and could speak coherently. I was asked about my time overall as an STA, what projects I worked on, and any advice I had for other STA’s. I loved doing the animations and I hope to do more projects like this in the future!
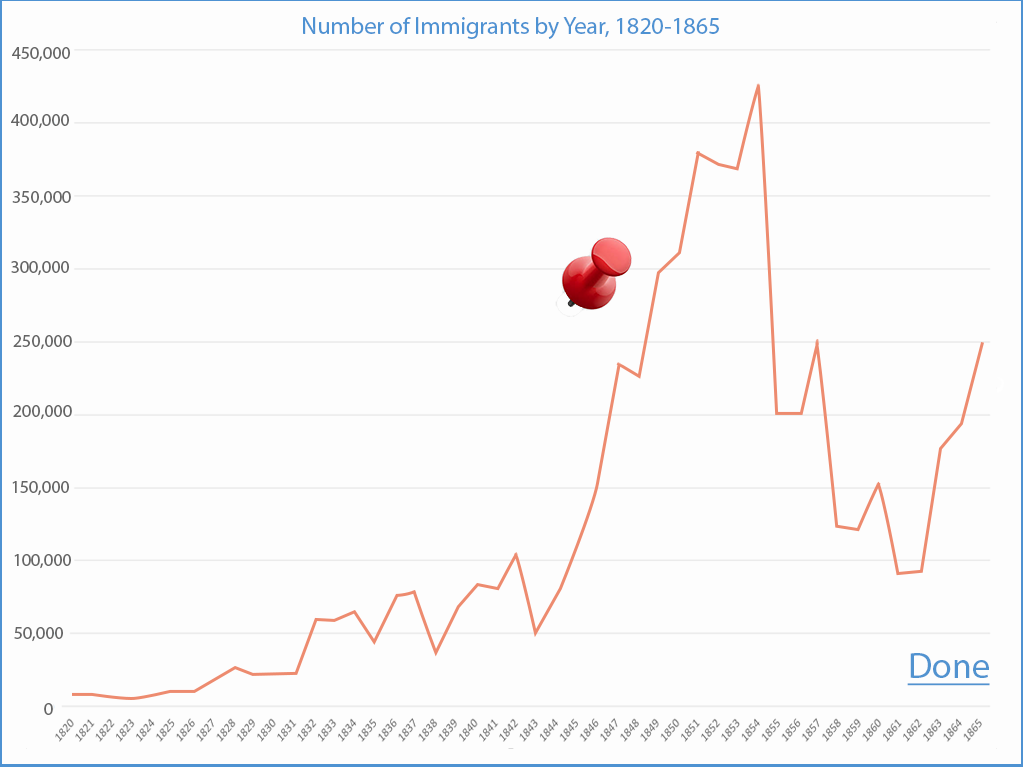
Here is a completed interactive graph for TBH I have made in Canvasser. In the first image, you’re supposed to drag the pin to the year and number where you think immigration was the highest. Then you press “done” and the actual graph shows up (the second image), and you can check to see if you got it right! I made this by using images, objects, and adding the interactive components in Canvasser.
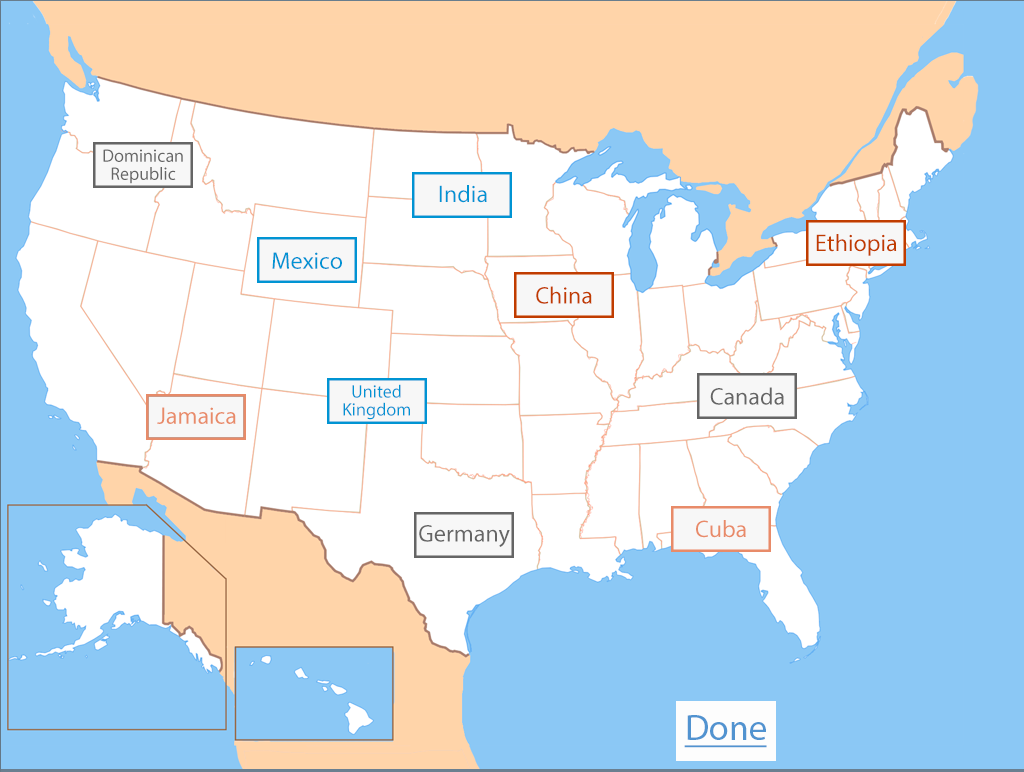
Here’s a close up of the map, and a demonstration of the labels dragged around on the map. (These are probably not the right answers…) I still have to add 10 more labels but I think it’s looking good so far!
I had forgotten to add this rather silly self portrait I did a while back. This and the other STAs’ self portraits are on the banner of the website.
- 1
- 2
- 3
- …
- 10
- Next Page »

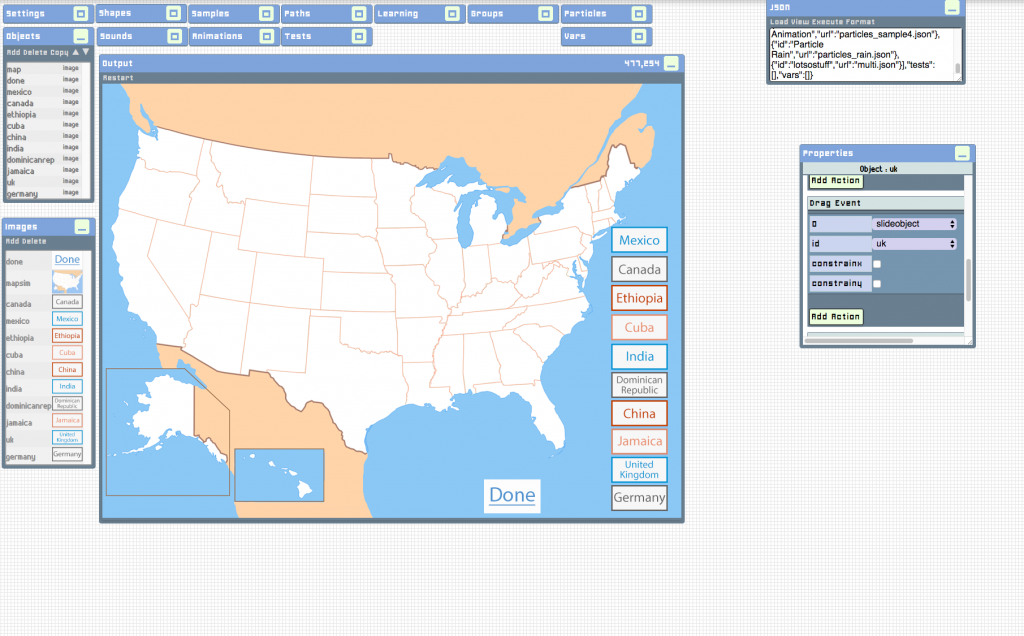 Here is an interactive page I am working on for Texas Beyond History. It is a map of the US, and the purpose is to drag the name of each country to where you think most of the immigrants from these contries went in the US. I have to make each label, and there’s 10 more to do!