• We are STAs
    • Diya Nair
    • Haley Ma
    • Kate Shih
    • Kyra Lee
    • Leilani Cabello
    • Lila Mali
    • Marissa Devivar
    • Nicholas Peasley
    • Raaga Srimadh
    • Shanda Horm
    • Shriya Atreya
    • Thang Truong
  • We were STAs
  • STA Presentation
    • STA Presentation 2017
    • STA Presentation 2016
  • Testimonials
  • Resources
  • Home

STA Blog

August 17, 2017 By Lauren Shafford

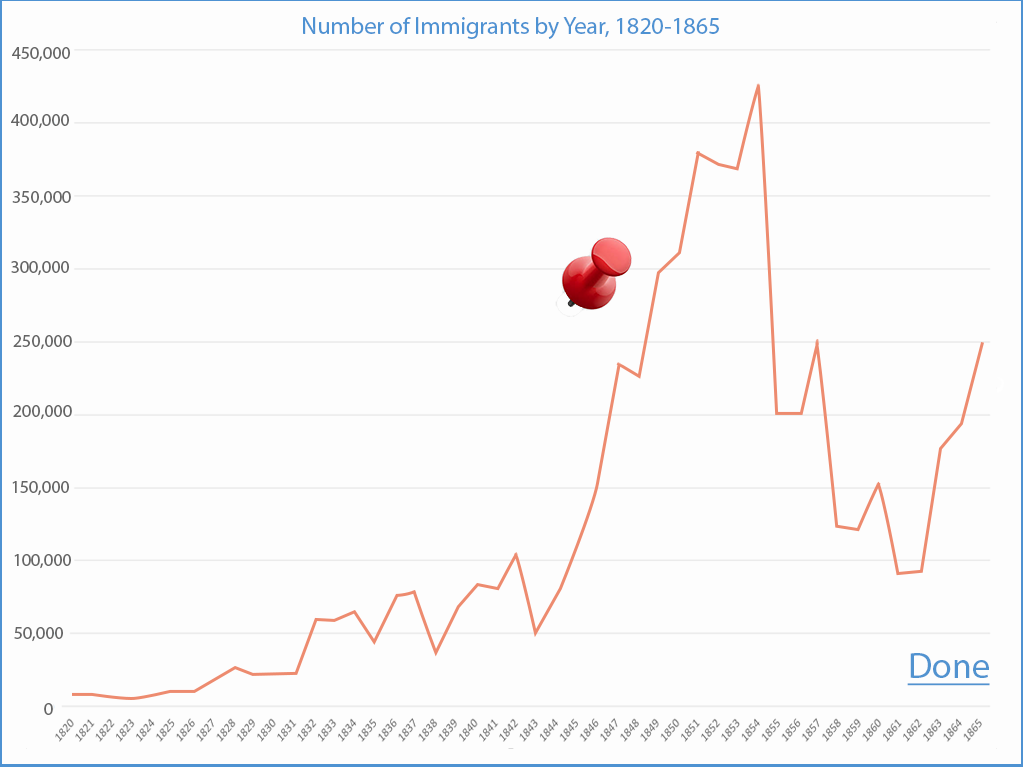
Here is a completed interactive graph for TBH I have made in Canvasser. In the first image, you’re supposed to drag the pin to the year and number where you think immigration was the highest. Then you press “done” and the actual graph shows up (the second image), and you can check to see if you got it right! I made this by using images, objects, and adding the interactive components in Canvasser.

Filed Under: 2017-2018

link to LAITS home page

Video STA Home

© 2025 Liberal Arts Instructional Technology Services | Production Credits