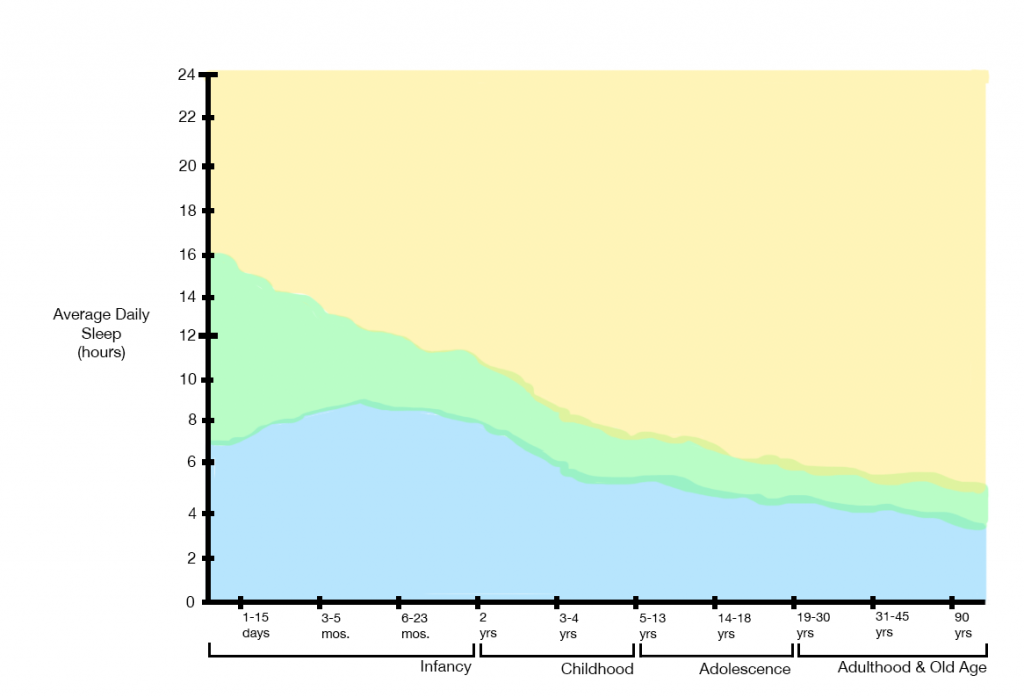
A lot of my time spent making this graph was mostly organizing my many layers. I wanted to ensure that if a change was necessary, it would be easy for the user who has access to the .psd file. Here’s what the graph looks like currently:
![](https://sta.laits.utexas.edu/wp-content/uploads/2019/02/Screen-Shot-2019-02-18-at-10.06.36-AM-1024x697.png)
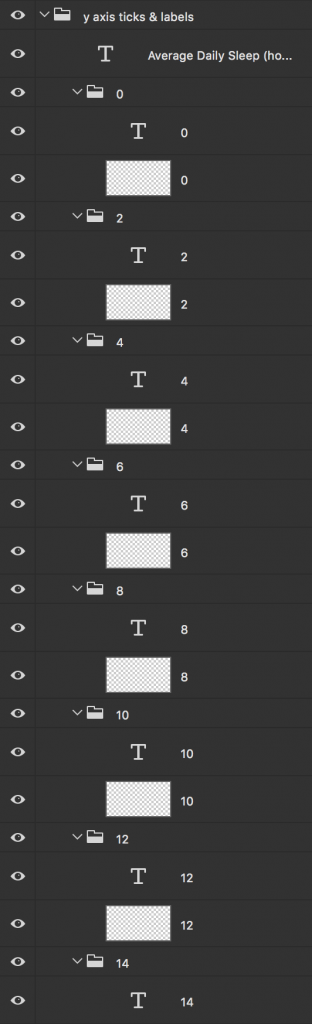
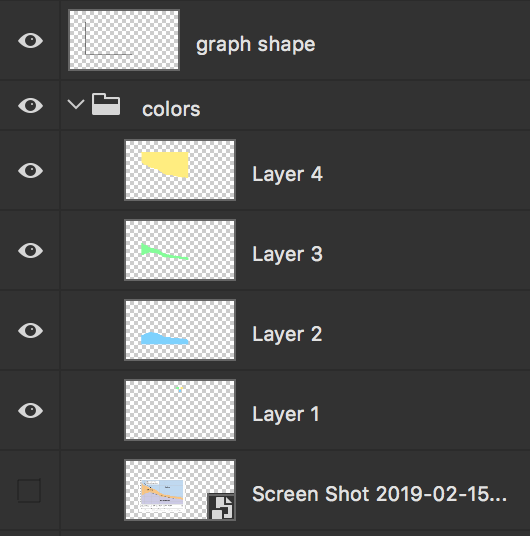
And here are all the layers I organized..
![](https://sta.laits.utexas.edu/wp-content/uploads/2019/02/Screen-Shot-2019-02-18-at-10.01.50-AM-356x1024.png)
![](https://sta.laits.utexas.edu/wp-content/uploads/2019/02/Screen-Shot-2019-02-18-at-10.04.07-AM.png)
![](https://sta.laits.utexas.edu/wp-content/uploads/2019/02/Screen-Shot-2019-02-18-at-10.04.18-AM.png)
![](https://sta.laits.utexas.edu/wp-content/uploads/2019/02/Screen-Shot-2019-02-18-at-10.05.07-AM-312x1024.png)
![](https://sta.laits.utexas.edu/wp-content/uploads/2019/02/Screen-Shot-2019-02-18-at-10.06.01-AM.png)
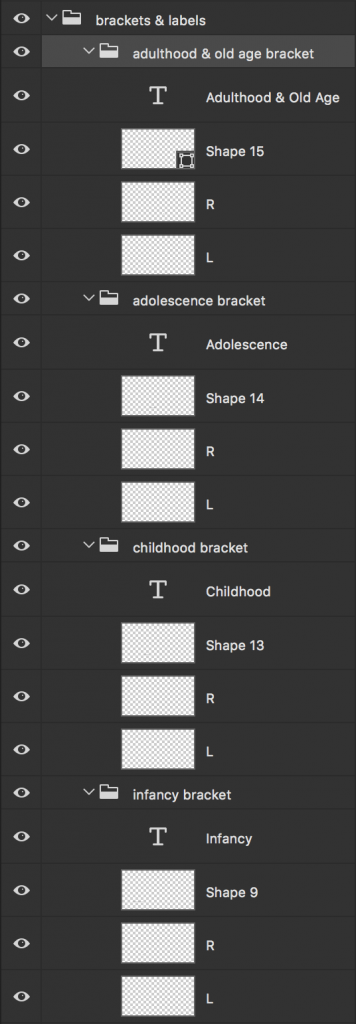
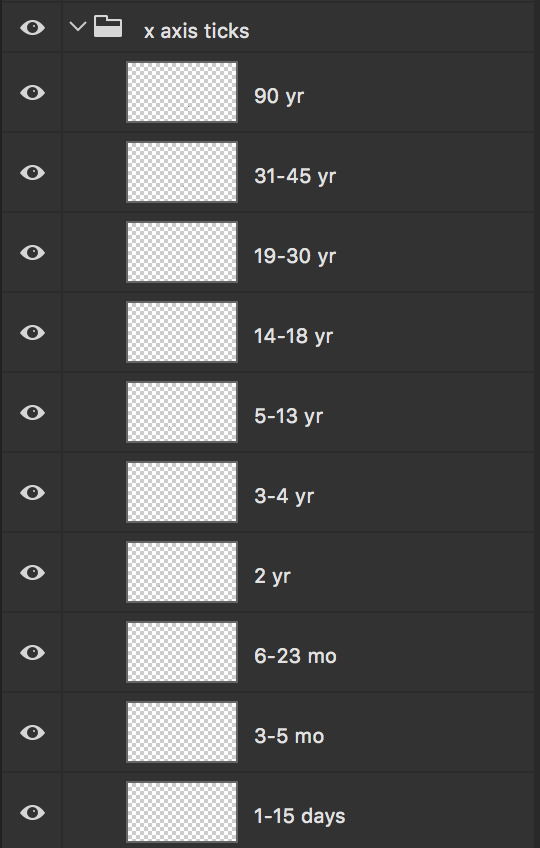
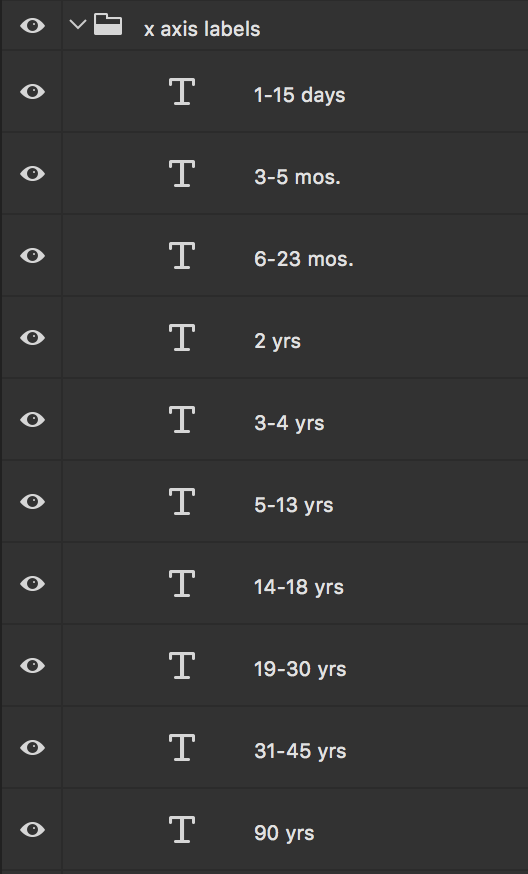
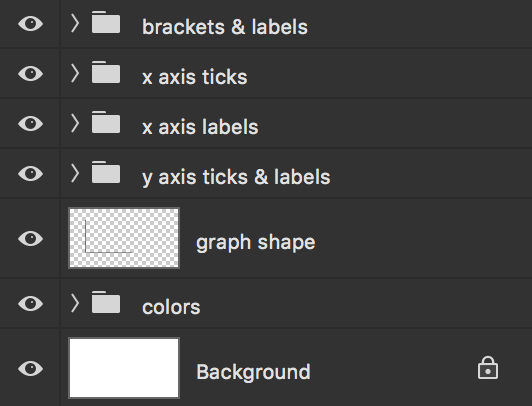
And here’s what they look like collapsed into their respective groups.
![](https://sta.laits.utexas.edu/wp-content/uploads/2019/02/Screen-Shot-2019-02-18-at-10.07.19-AM.png)
This will definitely be done on Monday and I will start on another graph/diagram then! That’s all for this shift 🙂