Week 28
Project: Data Visualization Tool (Continue)
Started on: Sep 14, 2023
Staff Guidance: Stacy
Description:
Continuing from last week’s progress, I explored again all of the columns and rows with scatterplot and bar graphs.
There are three rows that are important in this dataset:
- Graduate Advising Commitment Load (The workload and commitment that people commit to different committees)
- Total Committees (total number of committees people commit)
- Count of the dataset (how many people actually record their data)
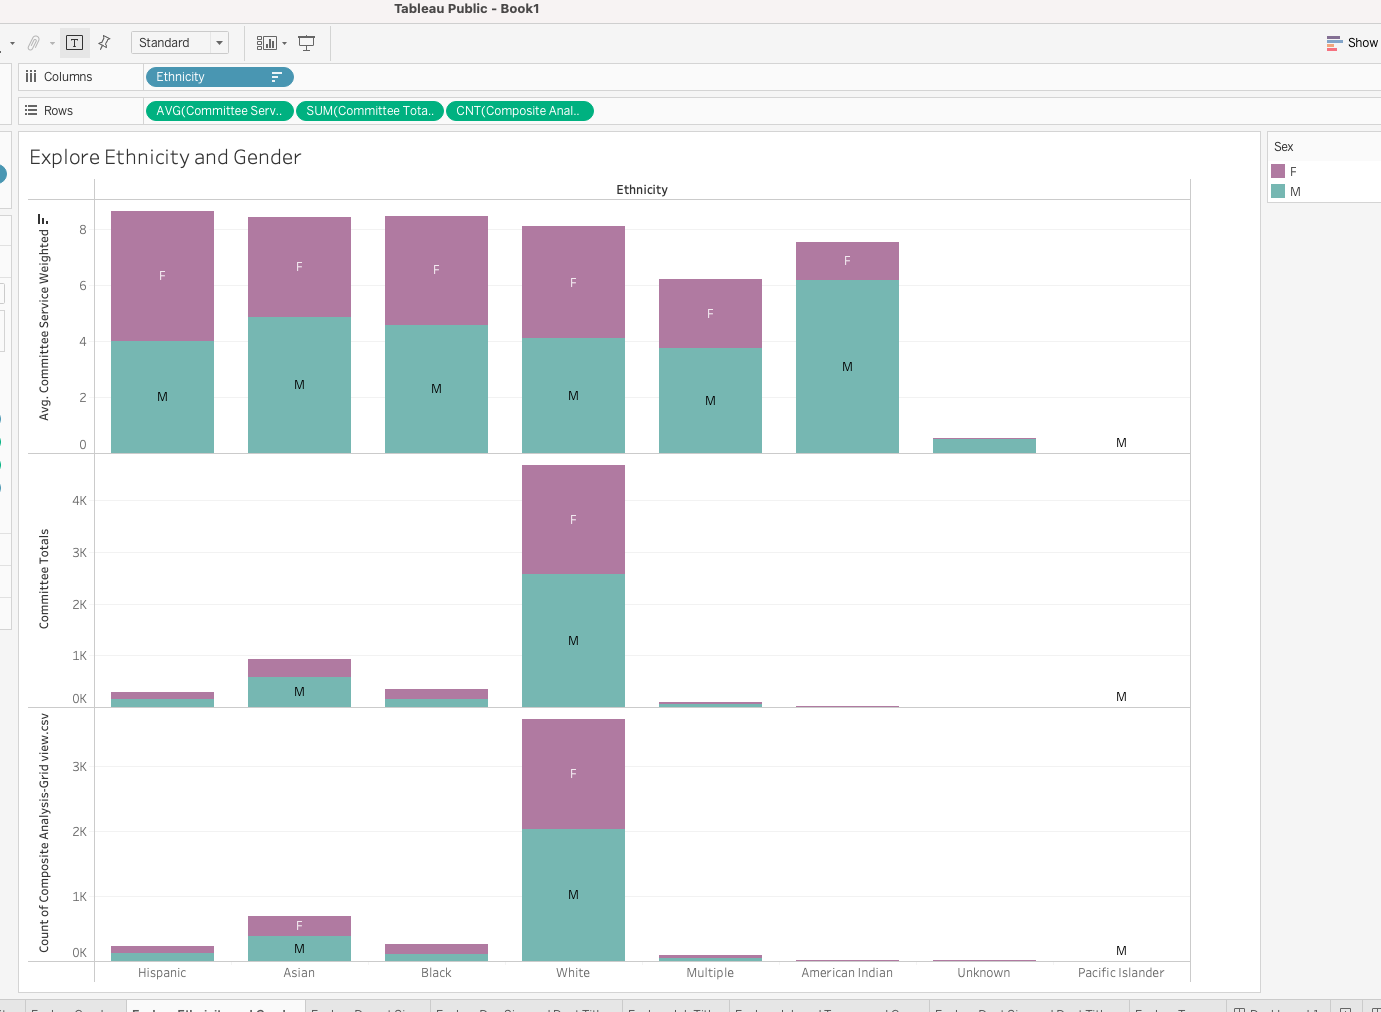
There are different columns that are important:
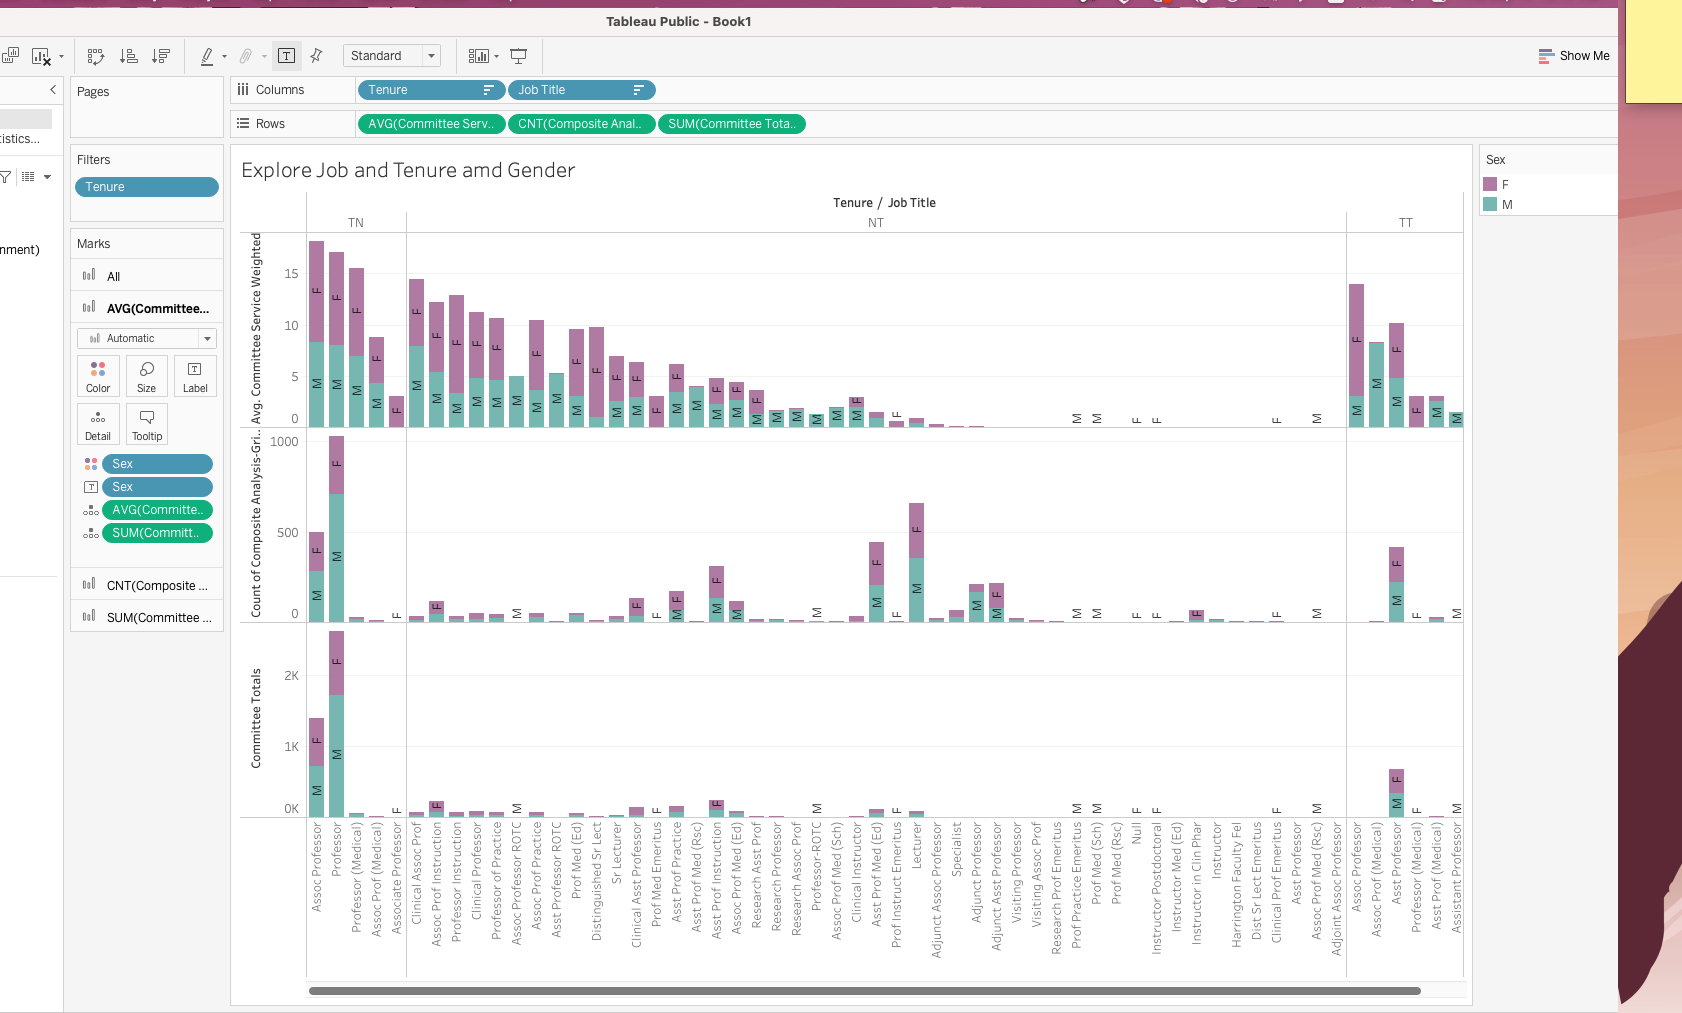
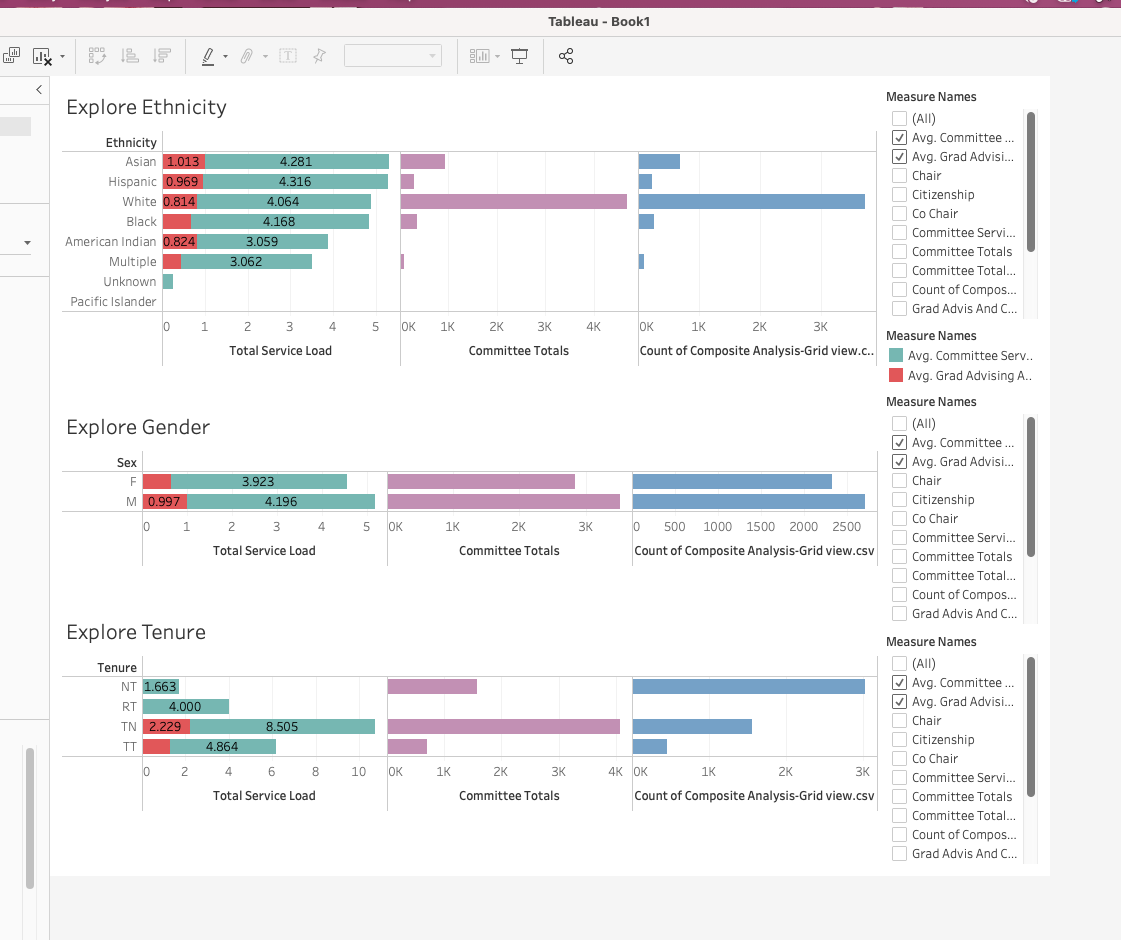
- Gender
- Ethnicity
- College
- Department
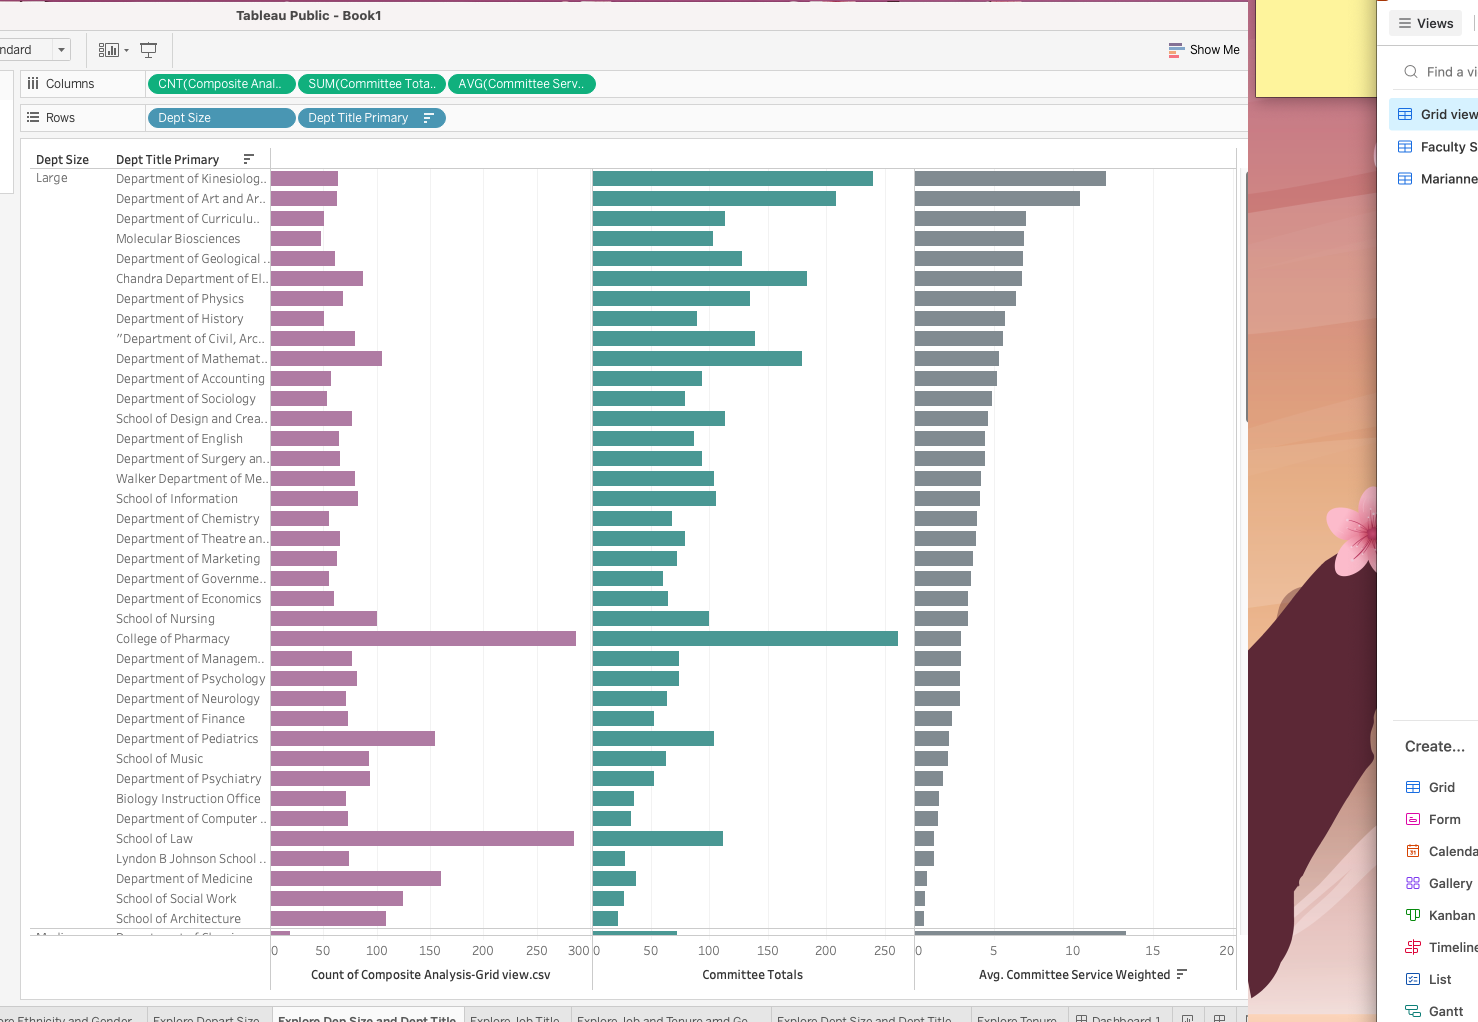
- Department Size
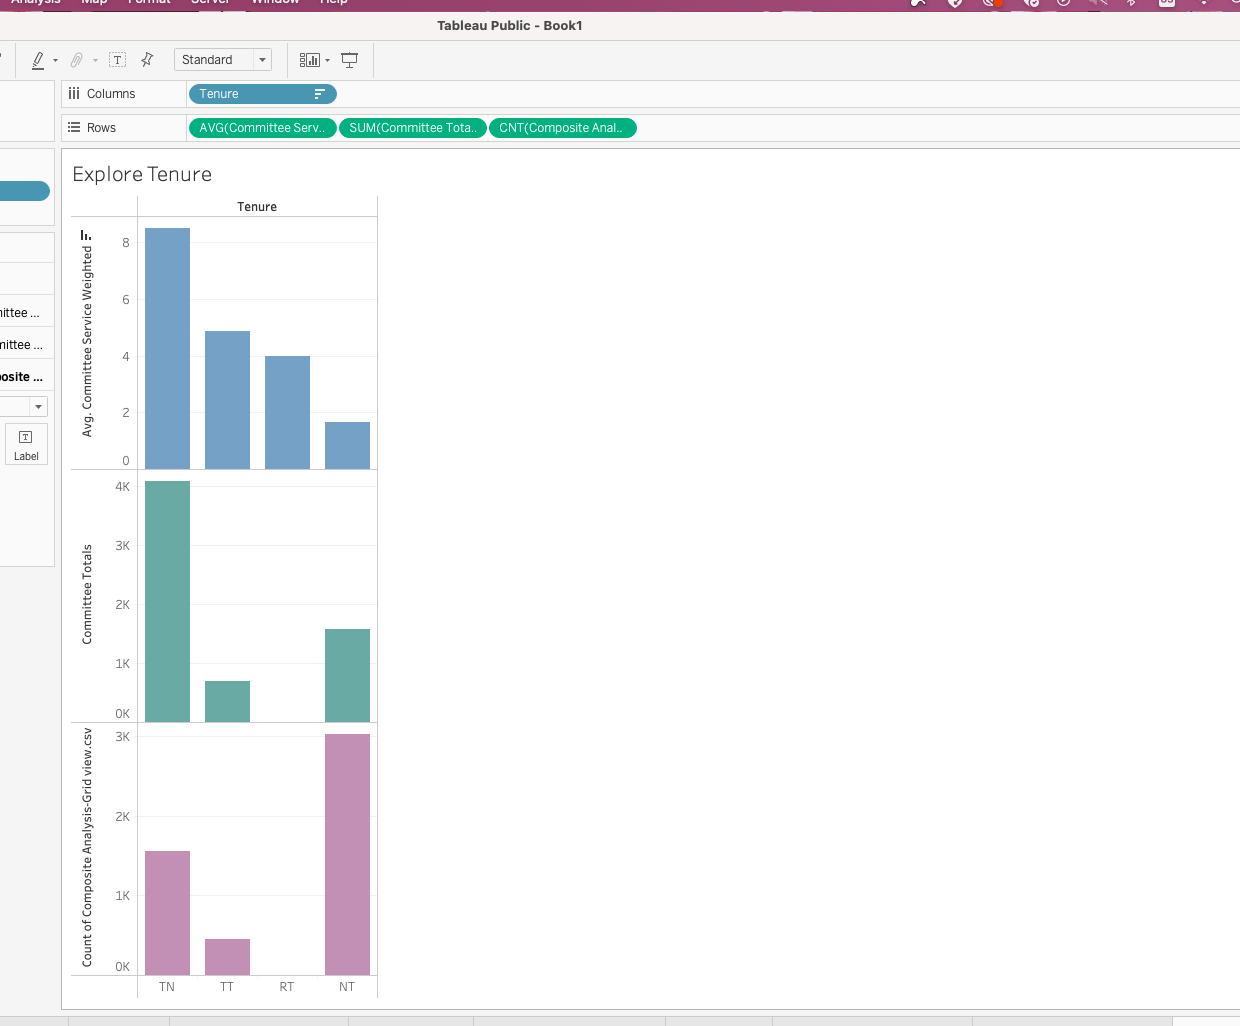
- Tenure
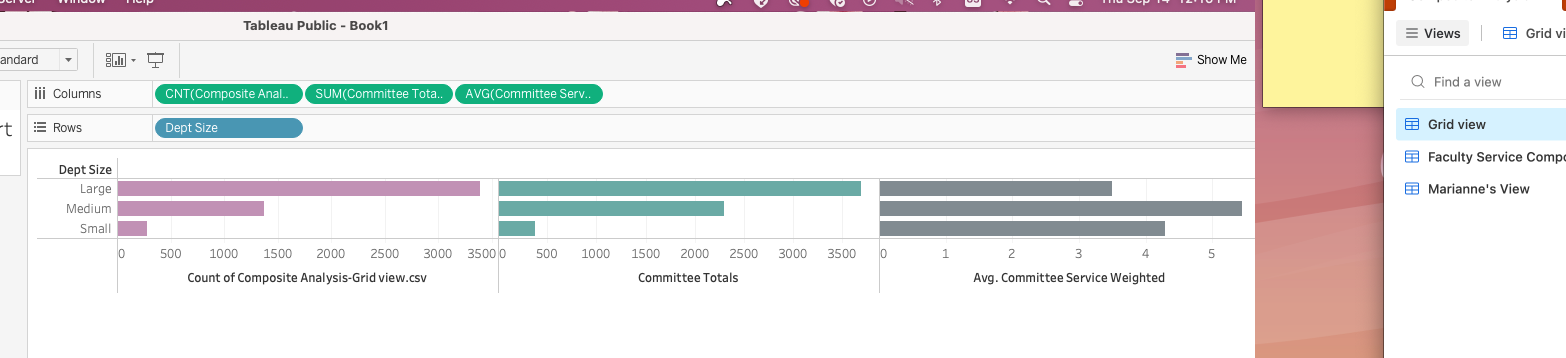
Some insights that I had:
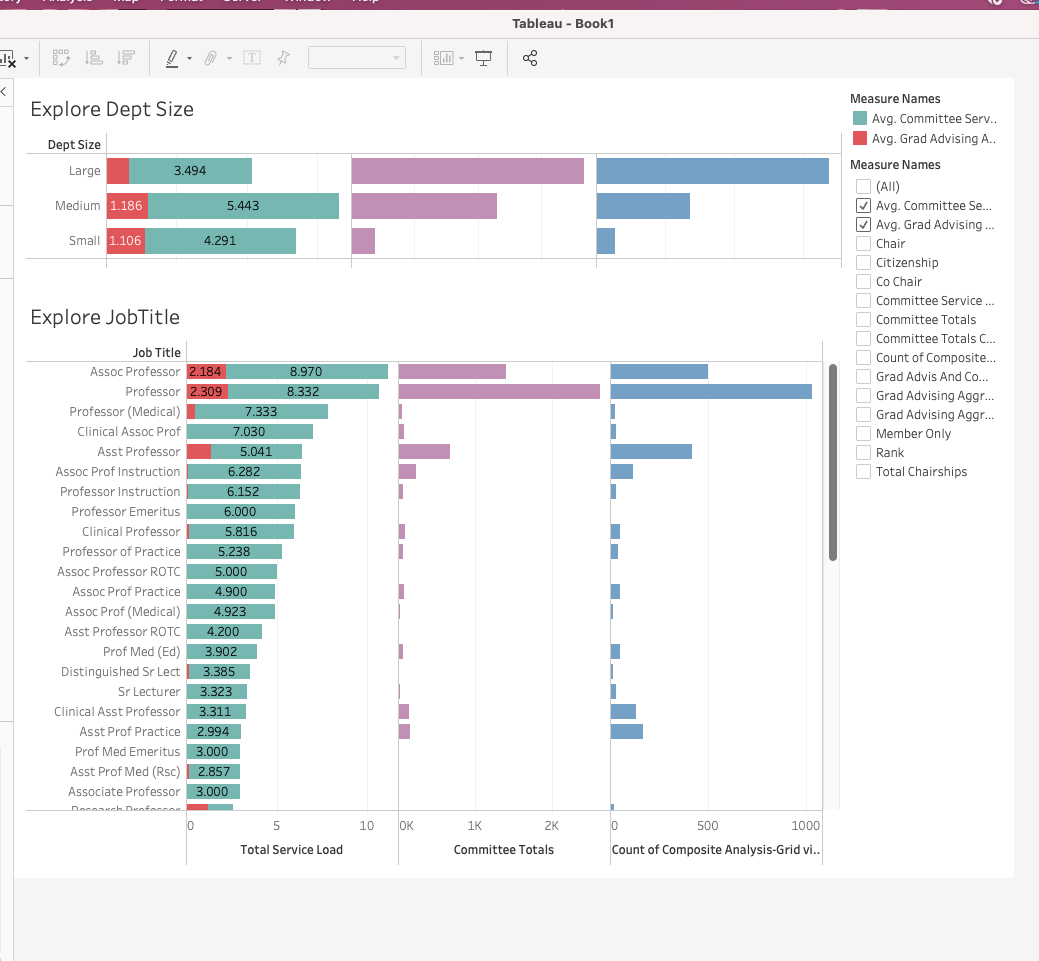
- On average, the medium department size has more committee total and more committee service followed by small and at last large even though large has the most committees in total. The surprising thing for me is that even though Small has the least committee total it has more committee service on average.
- It suggests that in small department sizes, people tend to take up more work and work for longer for committees.
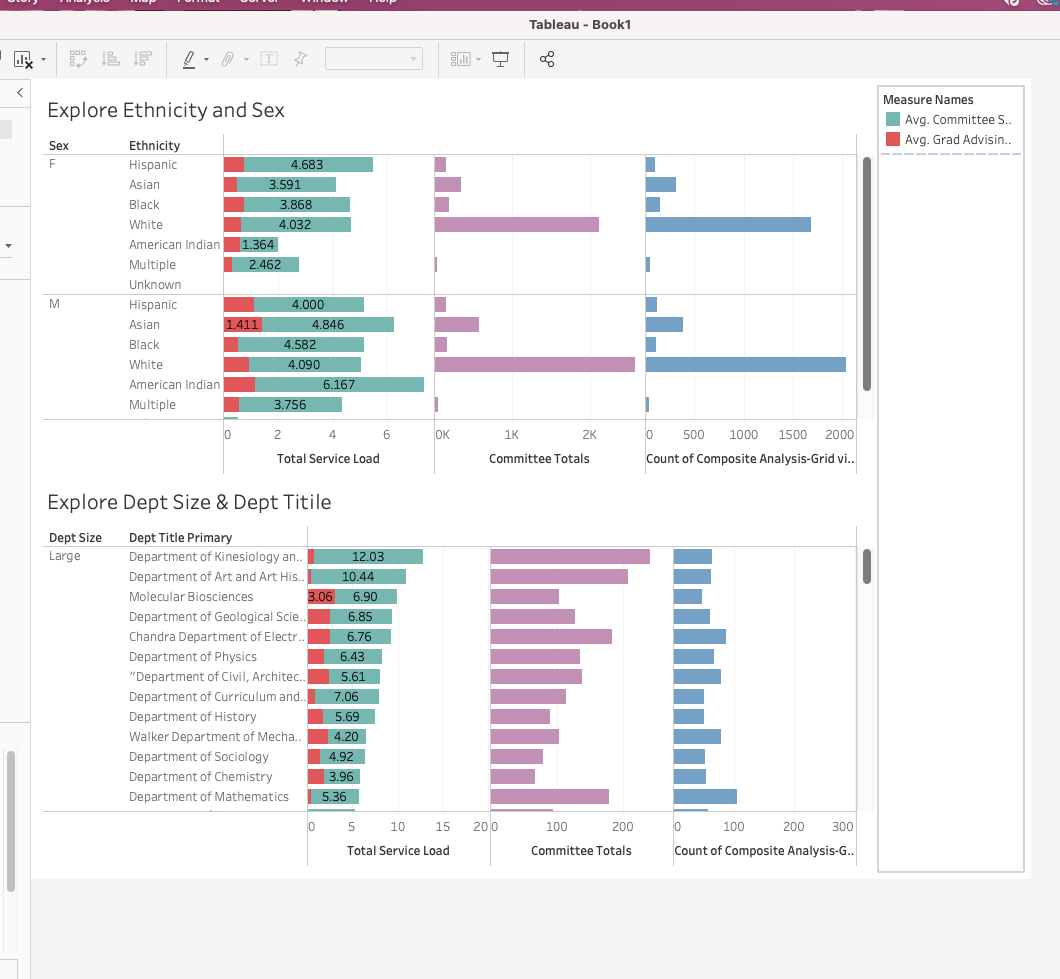
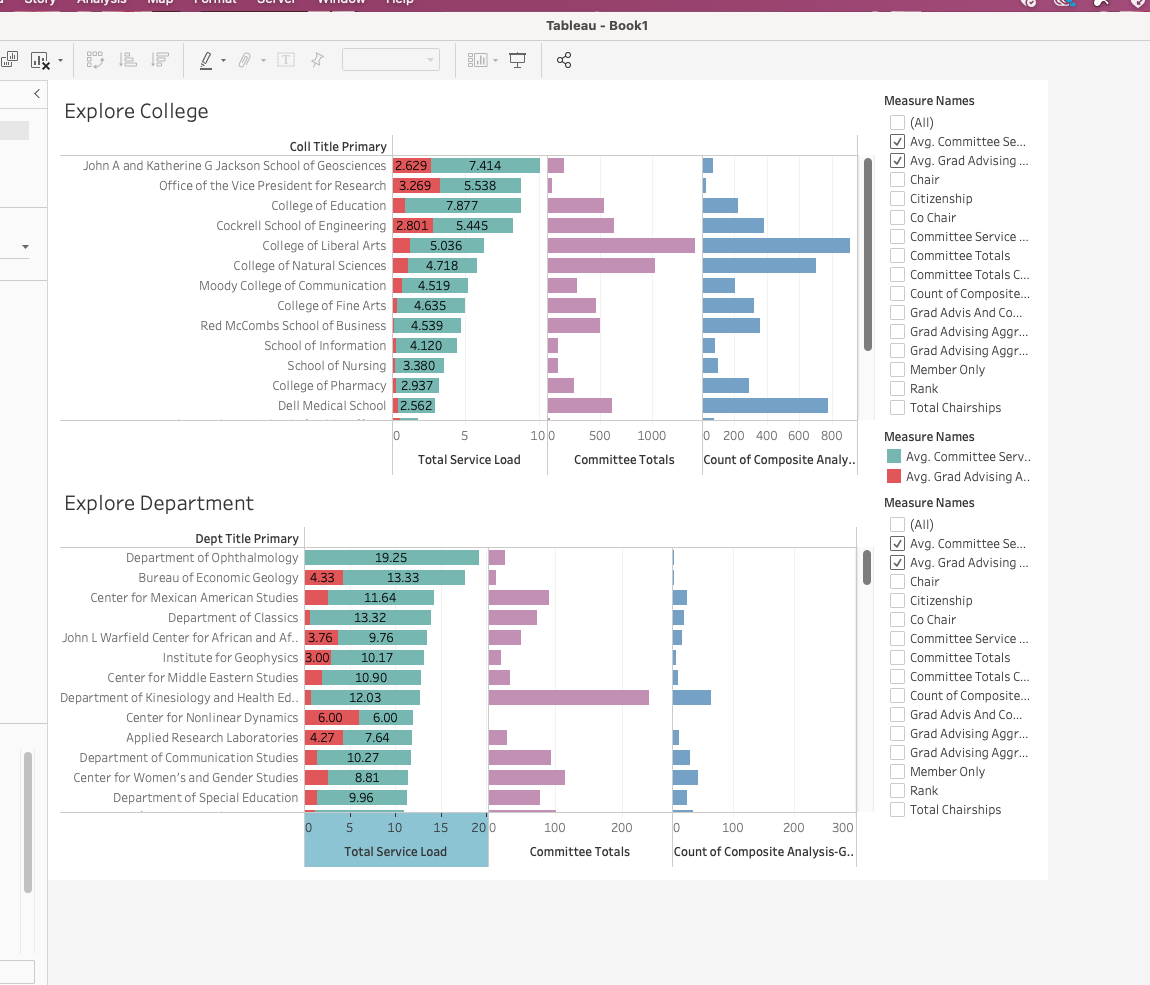
- In studying each college for each department size
- In large dept size, the College of Education has the most committee service even though the College of Natural Science has the most committee totals.
- In medium, the Red Mccombs department on average has the most CS even though the College of Liberal Art has the most CT in total.
- In small and large department sizes, Jackso School of Geosciences comes out on top in small and second in large for the most committee service hours even though the committee total is very small. -> Suggesting that these people work really hard and have a lot of commitment.
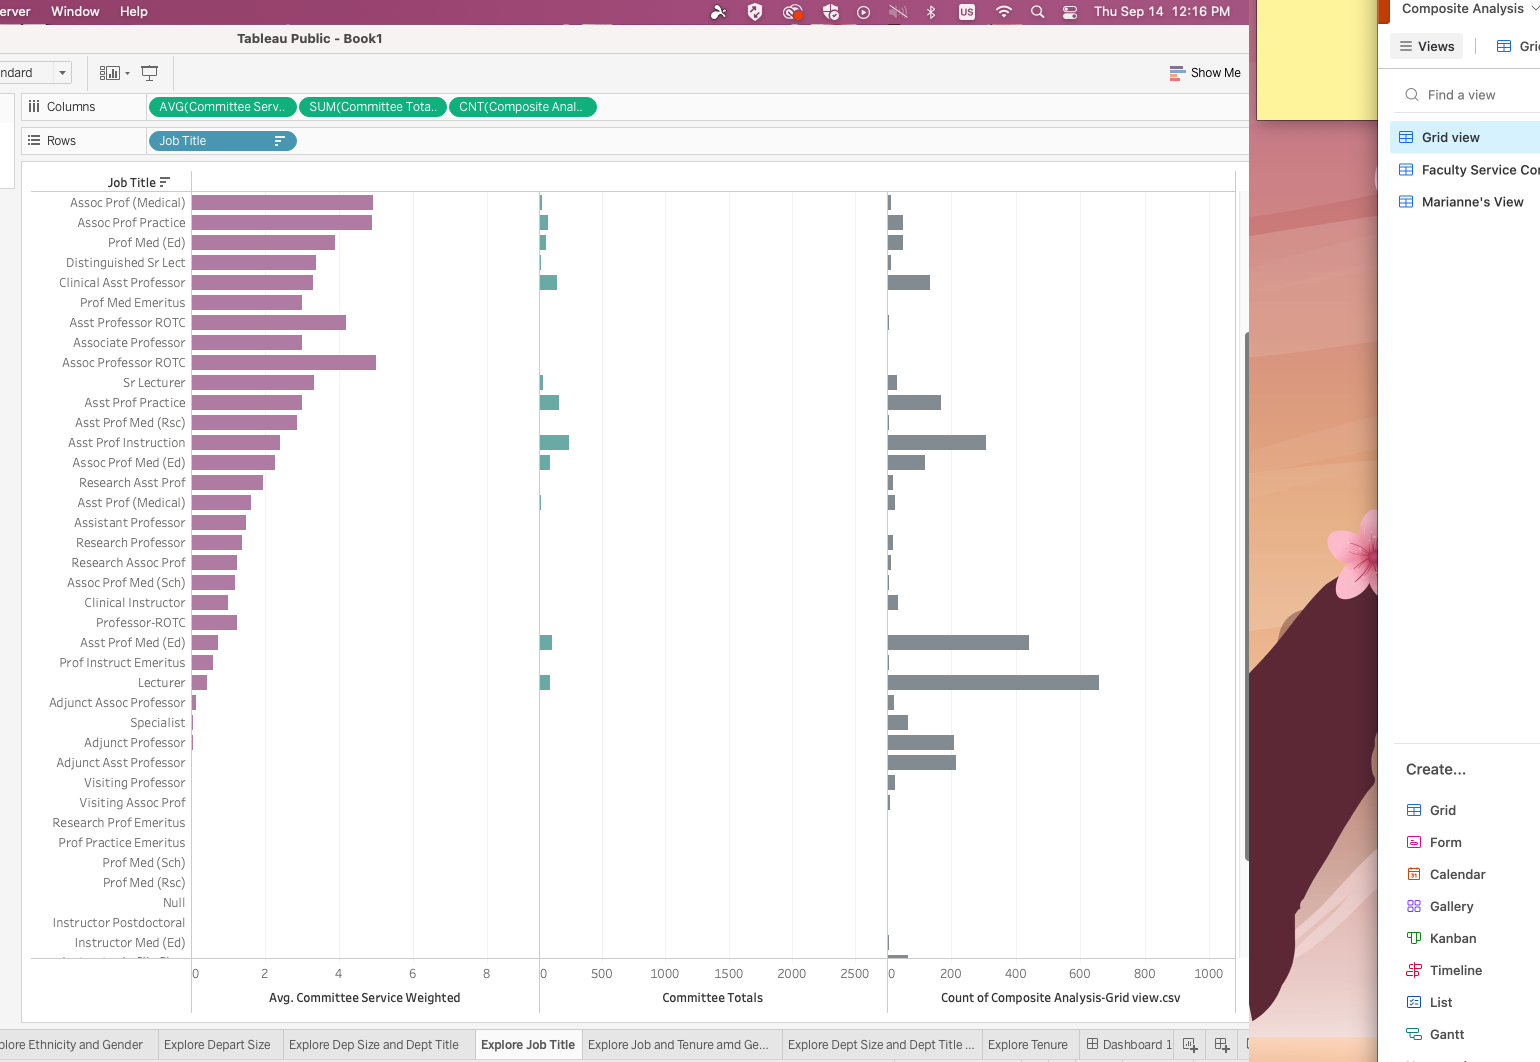
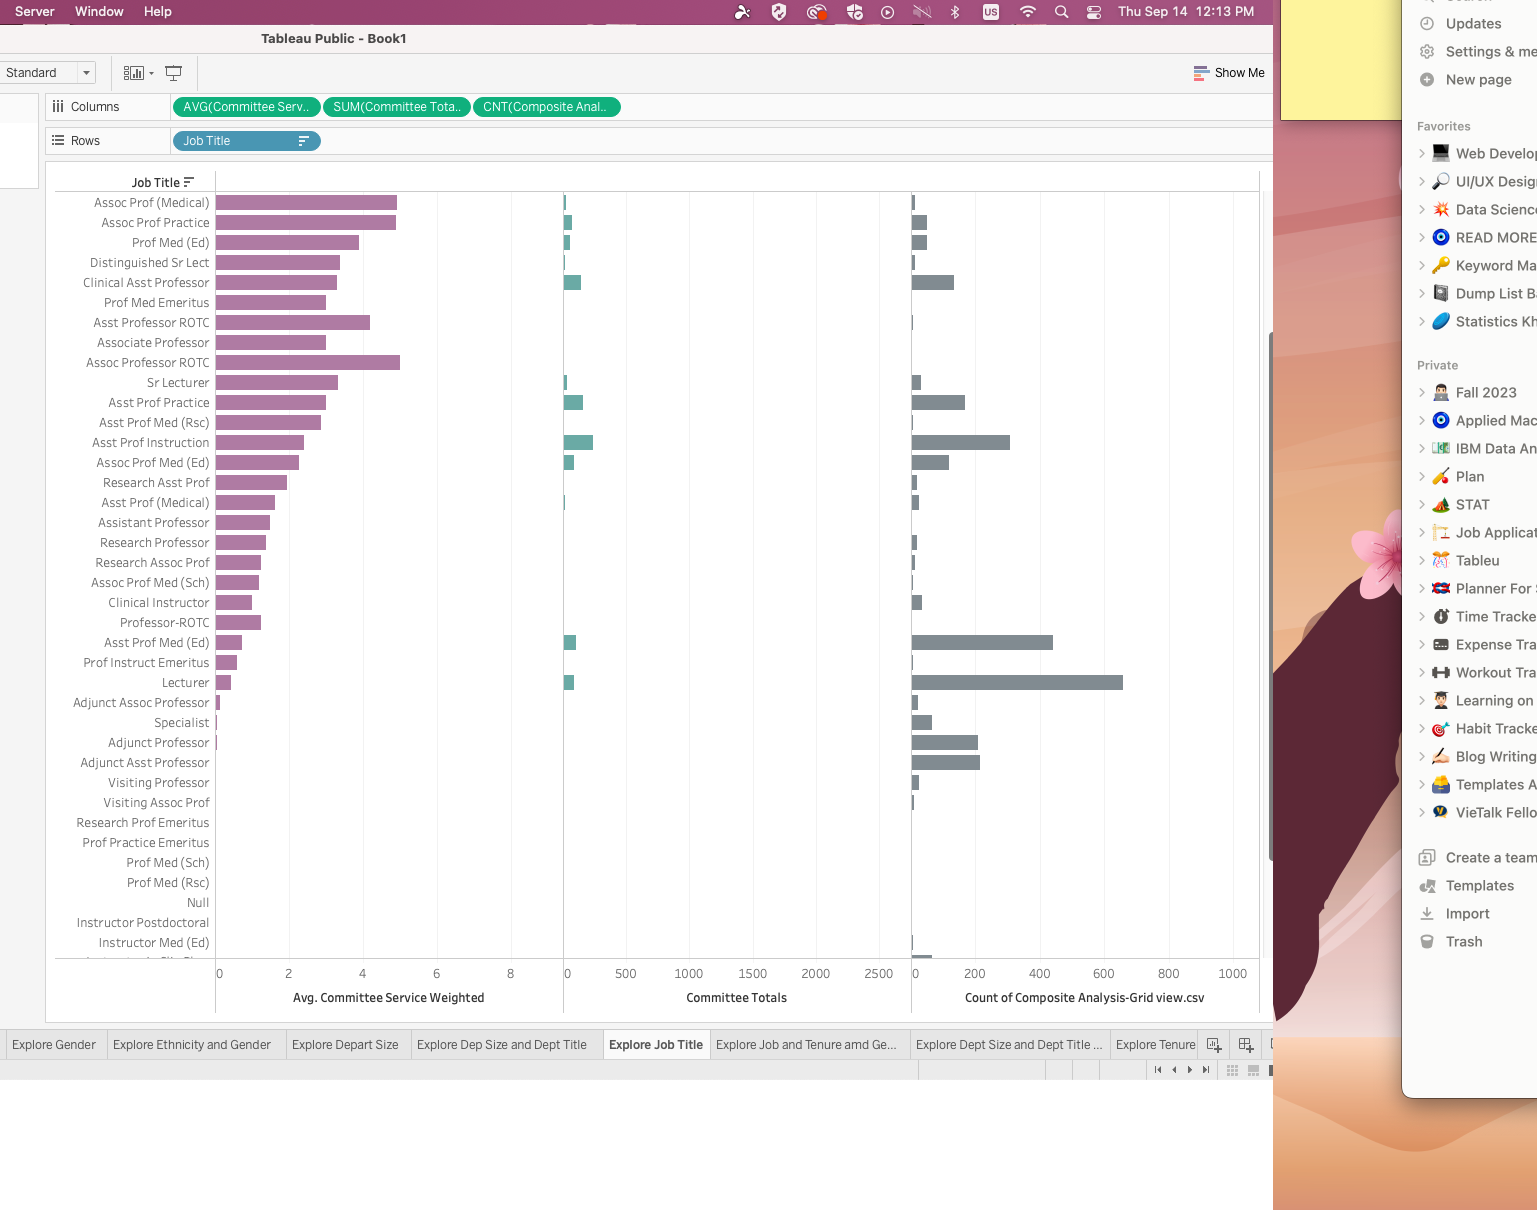
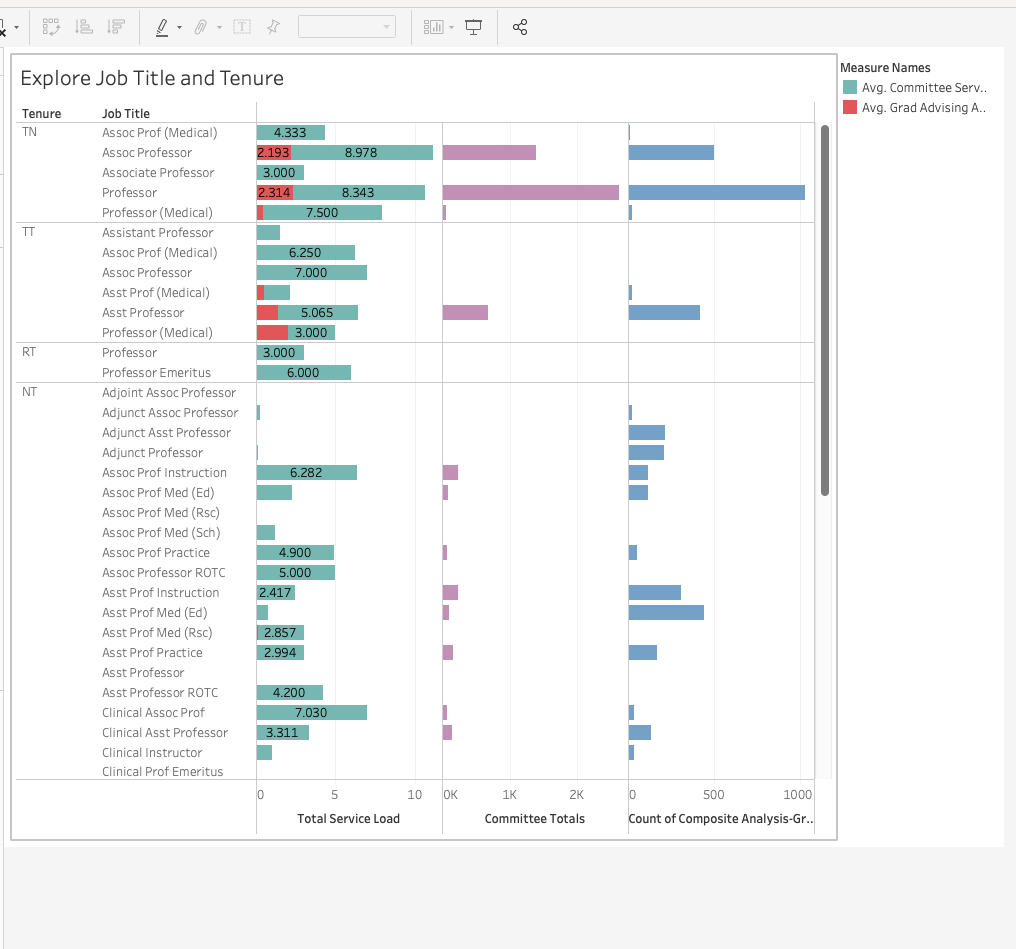
- Professor has more committees in total however on average, associate professor has more committees and more committee service of 8.97 and 2.79. respectively.
Actually, when I look back at this insight is wrong since I had department size but I paired it with college instead of department.
- In small and large department sizes, Jackso School of Geosciences comes out on top in small and second in large for the most committee service hours even though the committee total is very small. -> Suggesting that these people work really hard and have a lot of commitment.
- Therefore, we need to use department size and department college
The new graphics that paired the committee service workload and graduate advising workload.
The old graphics that used only Committee Service Workload