Week 27
Project 1: Master of Arts in Econ (Broken Links)
Started on: Sep 7, 2023
Completed on: Sep 7, 2023
Description:
For this project, I need to go to the updated website and convert any links that are linked to live-ma-eco to ma-eco. I am very happy that this website that I worked on last December has been published. The old website looks very plain, and this website breathes a whole new vibe to the Department of Economics. Therefore, I am just excited to see how the new website is finally live. This project seems simple enough, but I need to go through each different page and check for every single link. It is a little bit of work here and there, but I completed it in a couple of hours.
Project 2: Data Visualization Project
Started on: Sep 7, 2023
Staff Guidance: Stacy
Description:
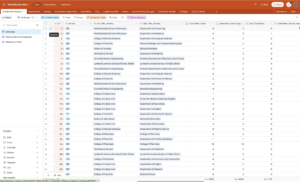
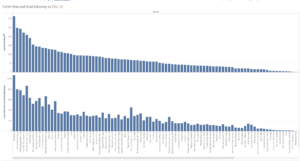
This project is very interesting. I was given a dataset on the faculty members at UT Austin and needed to visualize with different charts and graphs to see the distribution of an average of committees that faculties were on. This is a classic data visualization project that involved me exploring the dataset and building various beautiful charts to explain and explore the data. I used Tableau for this visualization. I need to poke around to see different things in the tools and create a narrative for the dataset. Overall, it is a really fun project.
Training: Tableau – Data Visualization Tool
Started on: Sep 8,2023
Description:
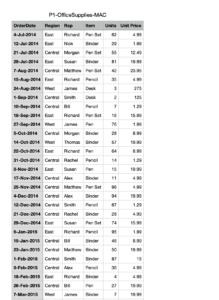
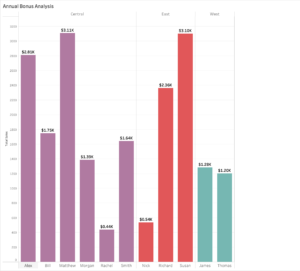
I got some training with Tableau where I got to build bar charts that display different data relating to the dataset on sales. The graph explains the sales for each representative and in each region. I find that working in Tableau is very easy and super intuitive. I love how Tableau simplifies the data visualization task and helps craft good visually appealing storytelling if the data analysts utilize it in their own interest.
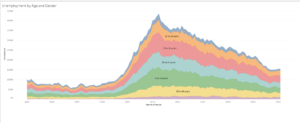
This is another graph on a different dataset. The dataset is about unemployment by gender and age groups throughout the years. This is the area chart that shows the unemployment sum throughout year by each age group and with gender filter.

