AFR 303 Graphs
Project: AFR 303 Course Graphs
Client /Prof: Dr. Colon and Dr. Gordon
Completion status: Started September 21
staff guidance: Maddy Kaniewski
STA team members: Abriella Corker, Rachel Sacks, and Sheryl Long
Description/plans: Professor Gordon and Colon would like visual representations of content and stats discussed within their powerpoint lectures to be made into simple graphs and chart to enhance learning via a visual aid.
To be completed: September 27th
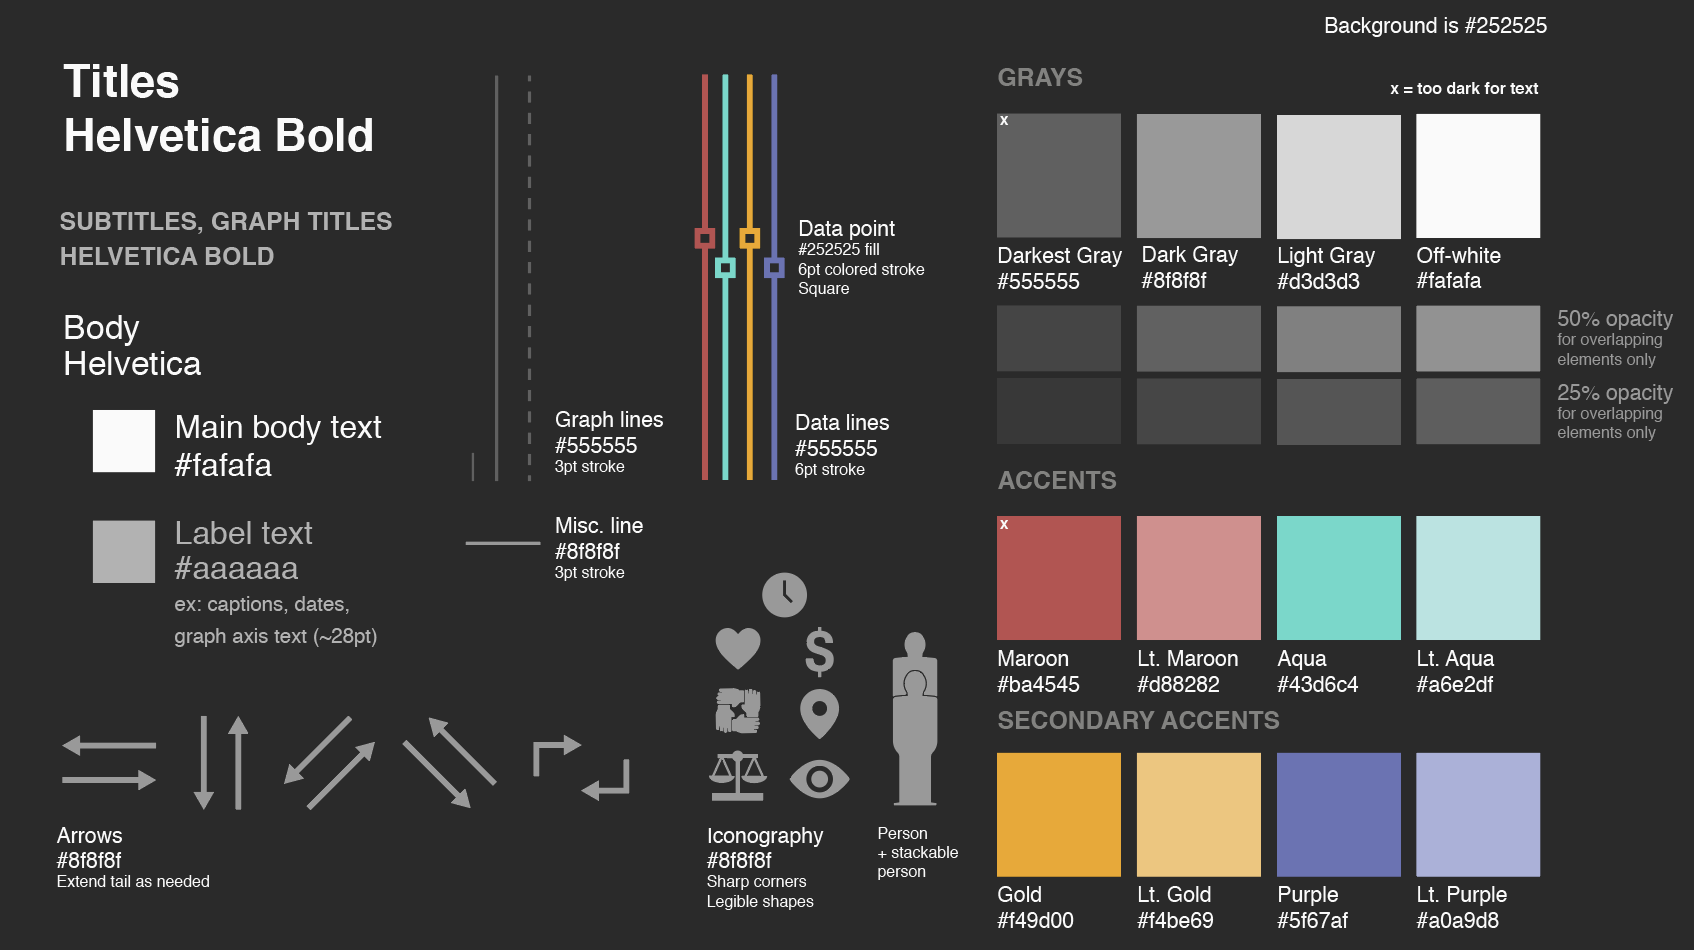
Maddy and I started off with designing and deciding elements of a template together. All the slides in the PowerPoints are on a black ground so we designed out template with that constraint in mind.
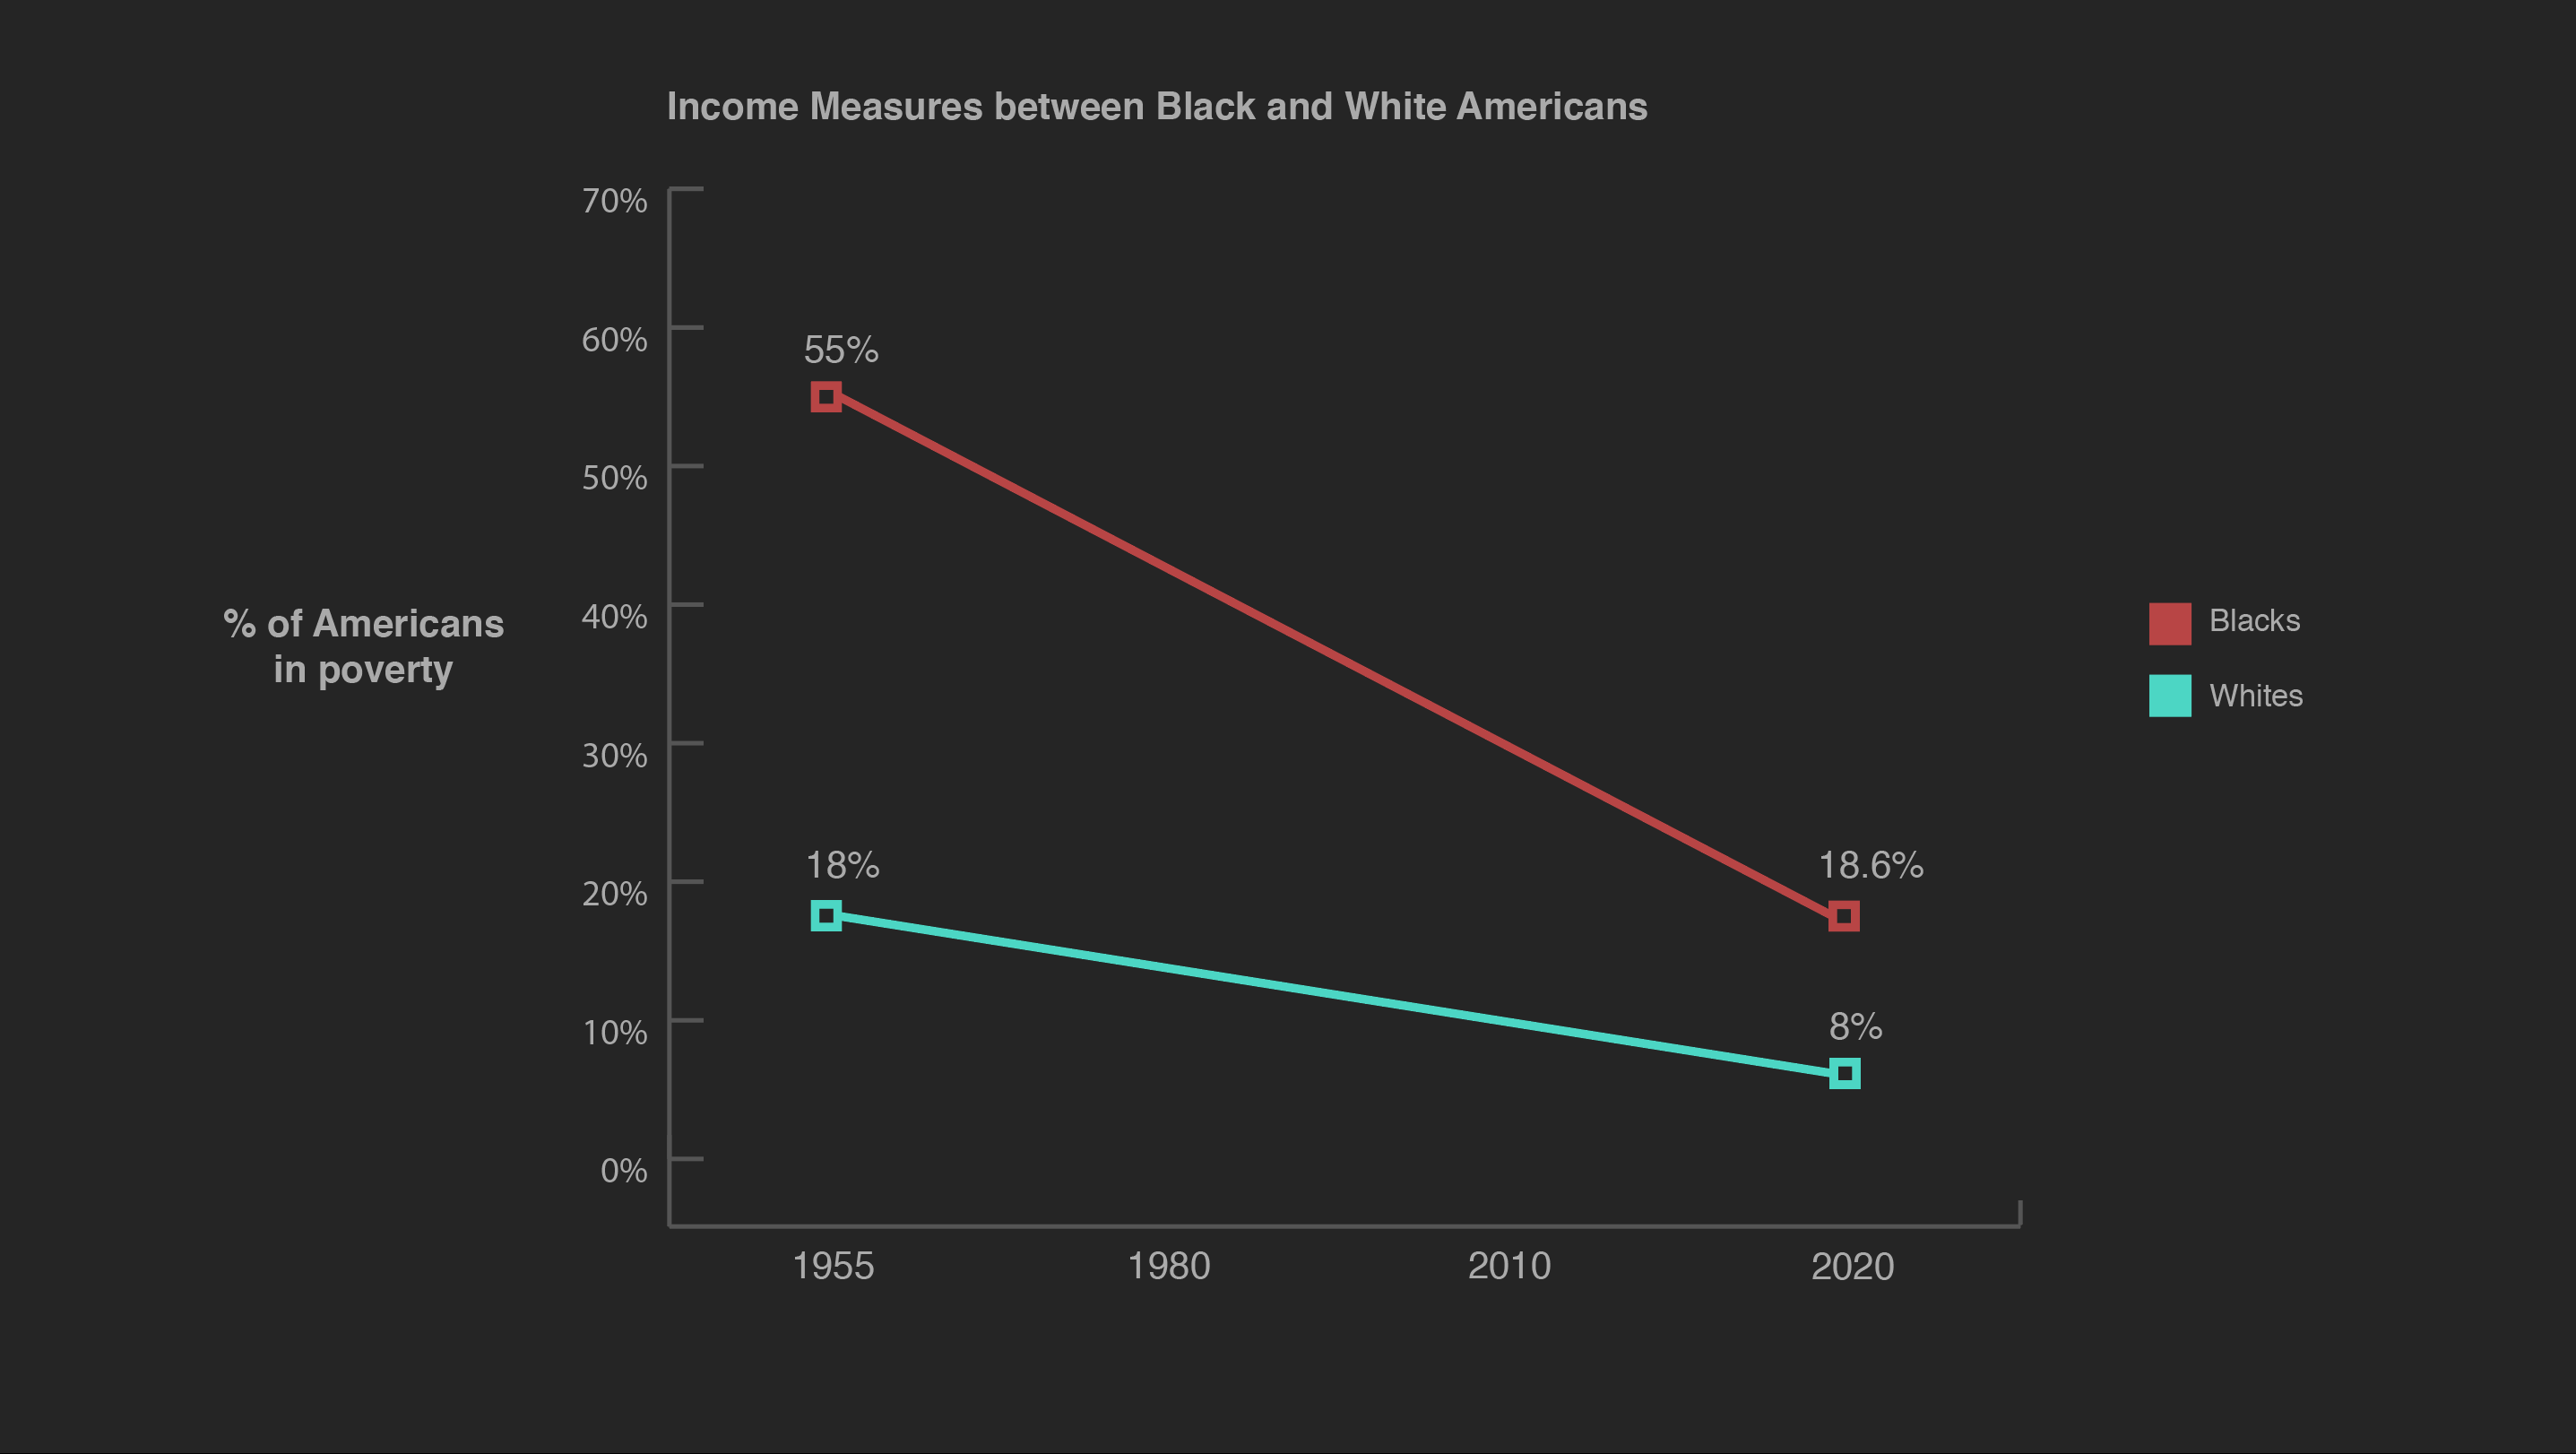
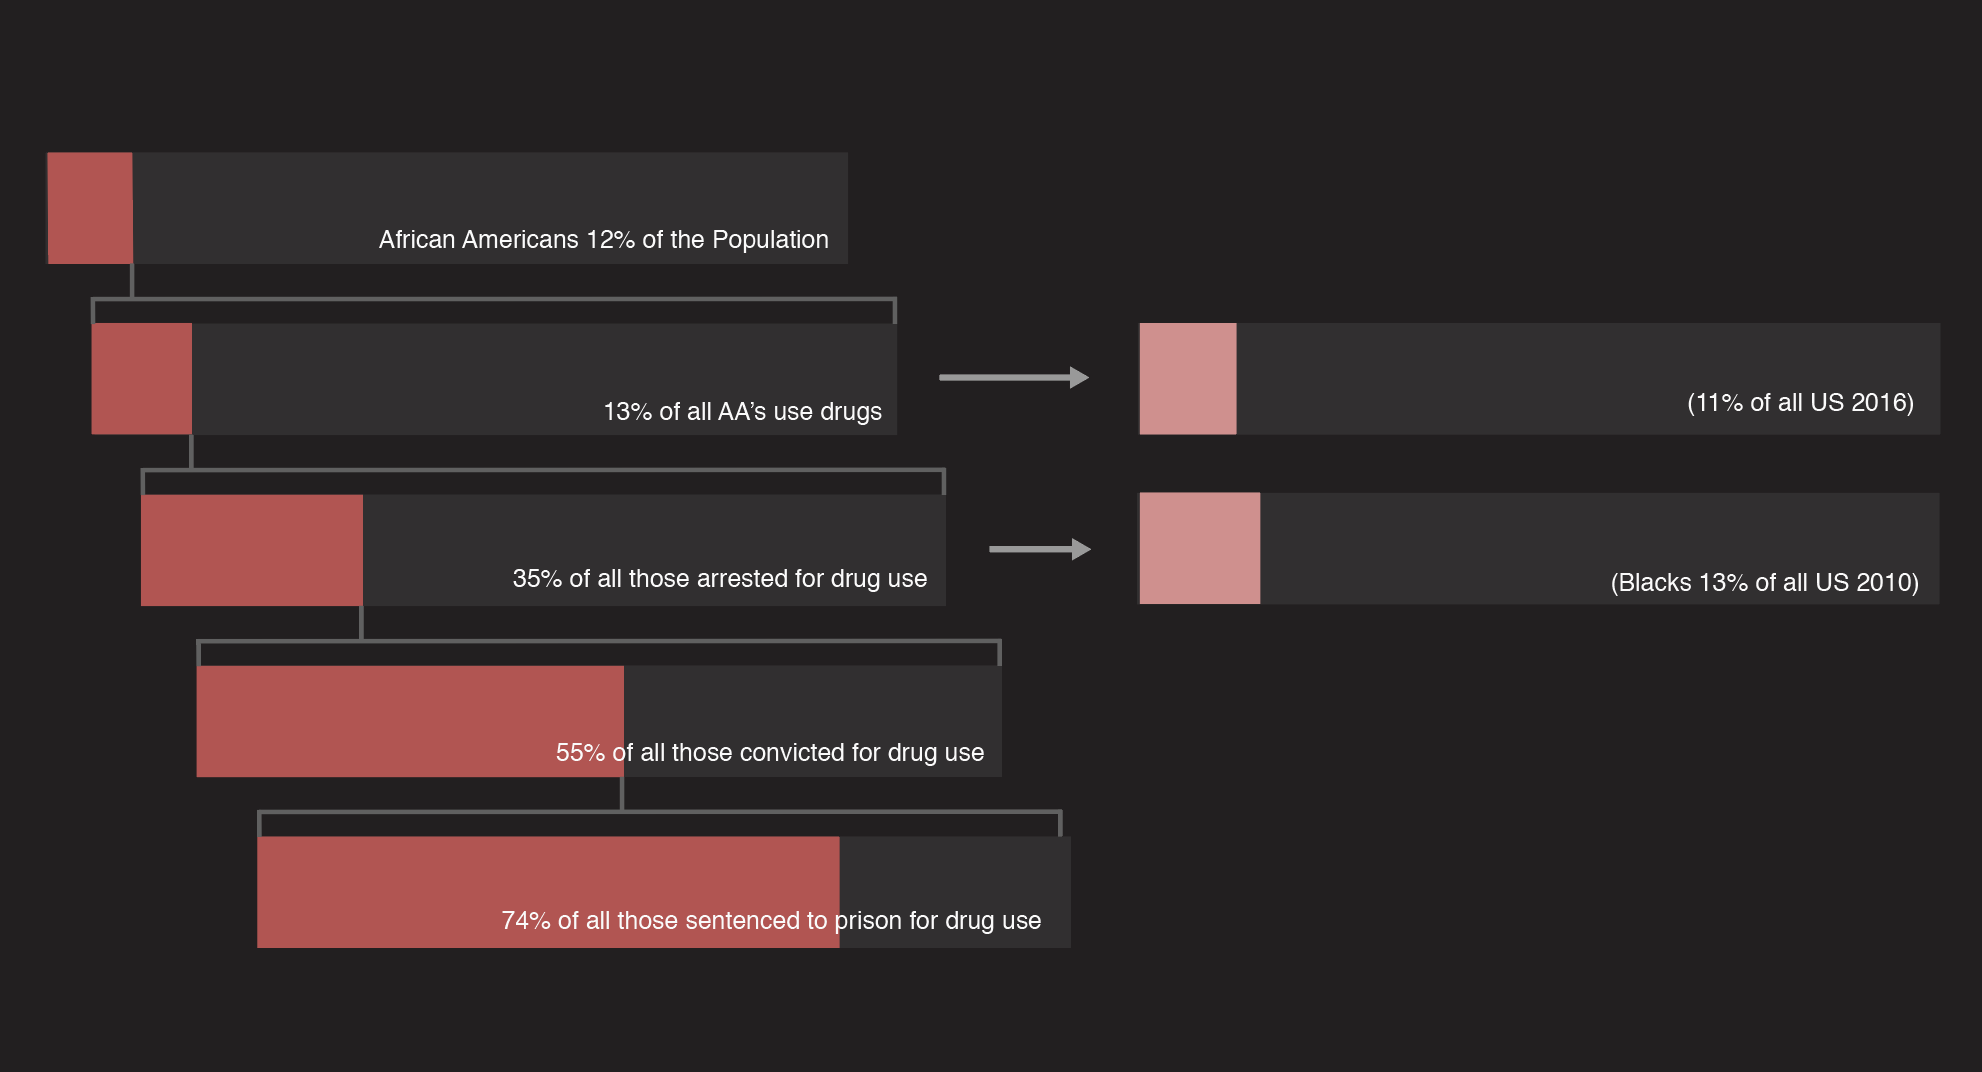
Once the template was finished, Sheryl, Rachel, Maddy, and I got together to discuss the first set of graphs to be made and went over together ideas on how to best represent the information within the slides. Here are what my two slides ended up looking like. They are two different shades of black background. Ignore that, it was just so I can work on top of a dark background. The actual assets were exported transparent for the professor.
Here is a chart that was already made but needed to be re-styled:


