INFOGRAPHS
Project: Nutrition Education Infographics
Client: Marissa Duswalt Epstein – Lecturer and the Director of The University of Texas Nutrition Institute
Completion status: In progress
Description / plans: Create info graphs to be used in her nutrition handbook. The first assignment is to create an info graph based off of a design brief before starting on graphs for the handbook to establish a sense of style for the overall look in accordance with the styling of the handbook.
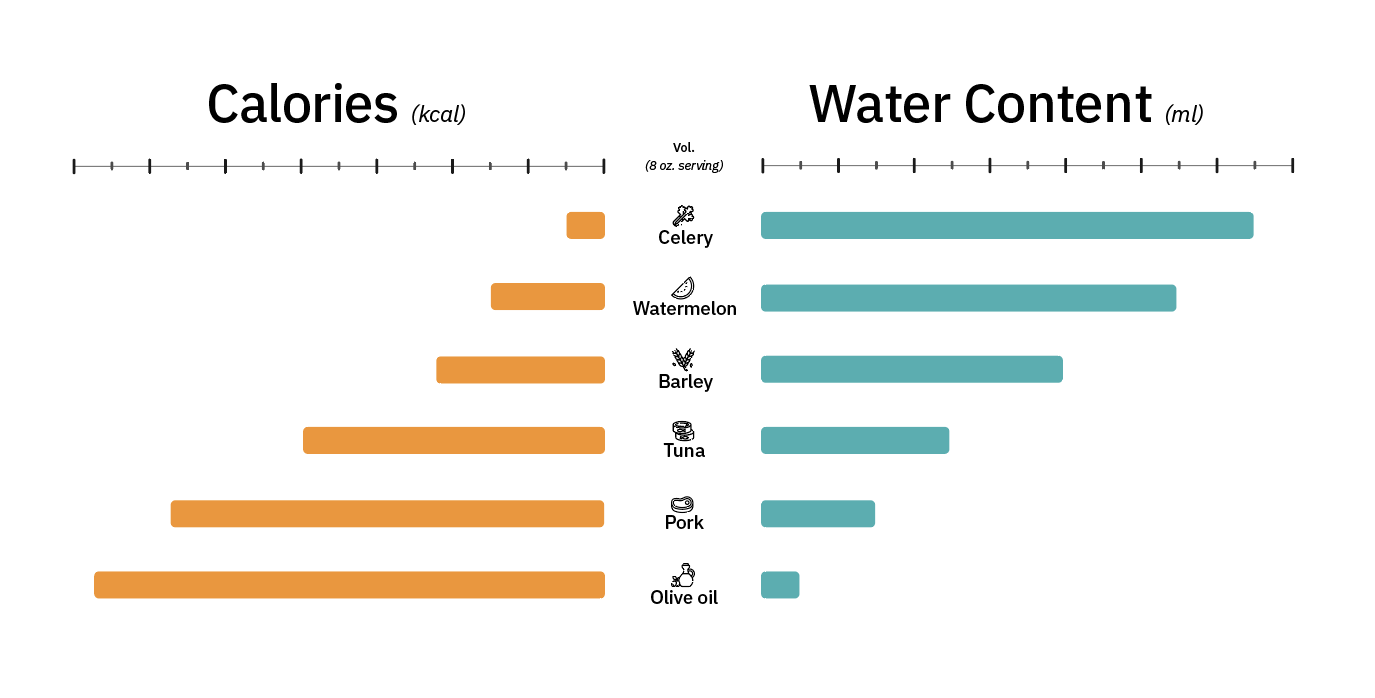
These are the rough sketches for the layout of the design brief. It is a comparison chart of calorie density to water content based on a certain volume of a type of food. I drew these out a Thuy then made edits on AI while I helped her make decisions on the type of edits to make within the file.
Here is the first graph that Thuy put together based off of my third sketch above. We are waiting for the client to provide feedback on what she thinks of the design. It is very simplistic to not distract from the information trying to be conveyed through the graph and the text that would be on the handbook. We based the look off of the design guidelines and the appearance of the handbook. Thuy added these icons to make the graph appear more visually appealing and less plain.


