Week 32
Project: Faculty Office
Started on: Oct 26, 2023
Staff Guidance: Stacy
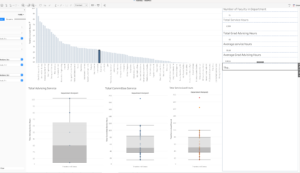
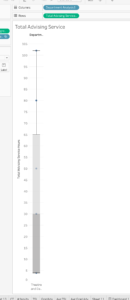
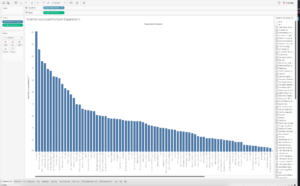
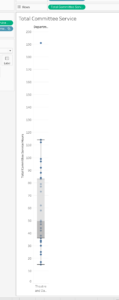
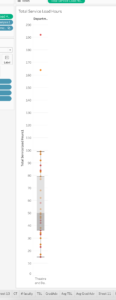
Description: The project aims to find patterns of the total service loads for each department. The deliverable is an interactive dashboard that lets the user choose the department and see the corresponding information for various aspects of the department itself. I successfully created a simple Tableau interface that can help with displaying and showing the information based on the user’s input.
Project: Shiny App
Started on: Oct 27, 2023
Staff Guidance: Stacy
Description: This project consists of two smaller project that involves the use of Shiny App and R to make and deploy a simple website that lets the user input the spreadsheet and show the according output.
- Project Number 1: Voyage. The client already has the code for building the interactive map, but he does not know how to let the user input their own CSV and download the output as an HTML file.
- Project Number 2: Density Map. This project needs some more input and examination. The general idea of this project involves the display of the map based on the user’s CSV files and the user’s selection of the desired transformation. The deliverable is a map that shows the density instead of borders. The user can download this as an image or pdf. Moreover, in order to actually use it, the user needs to go to Projection Wizard to get the string to set up the map parameter correctly.
