STA301 Introduction to Data Science &
STA309 Elementary Business Statistics
This is my first custom course package, the communication process was definitely a lot more complicated than remote course projects. I never worked on any studio set graphics so there were confusions but it was an interesting learning experience. I was able to hand off the graphics right before the deadline but I think design wise there is a lot of space for improvement. Hopefully I get another custom course project, it was fun 🙂
Keynote slide provided by Professor Scott:
Professor Scott wanted a design that matches his lecture, so we used the 3 color in his keynote slides as our main color palette.
Deciding on the general look-feel
I found some images online and edited them to create mock-ups for the PMs
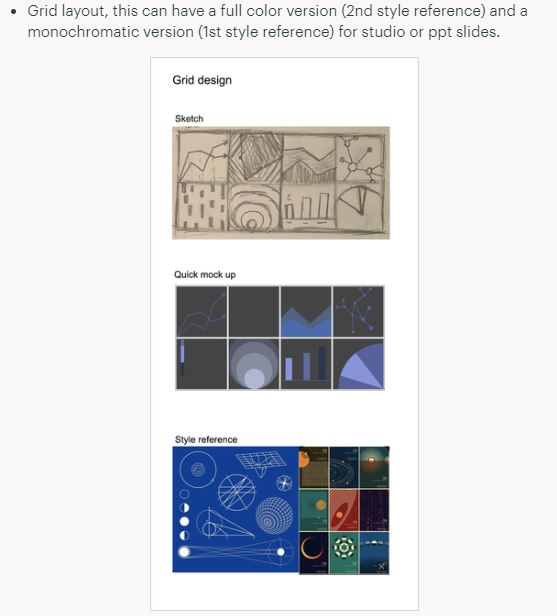
La’ Kayla liked the third design, and Suloni pointed out that the professor is looking for something that shows variations of data visualization so I based my designs on different types of graphs.
First design draft
I came up with 3 designs
Personally I like the grid layout the most.
Second draft
I moved forward with the grid design
Final
Main course graphic:
Canvas graphics:
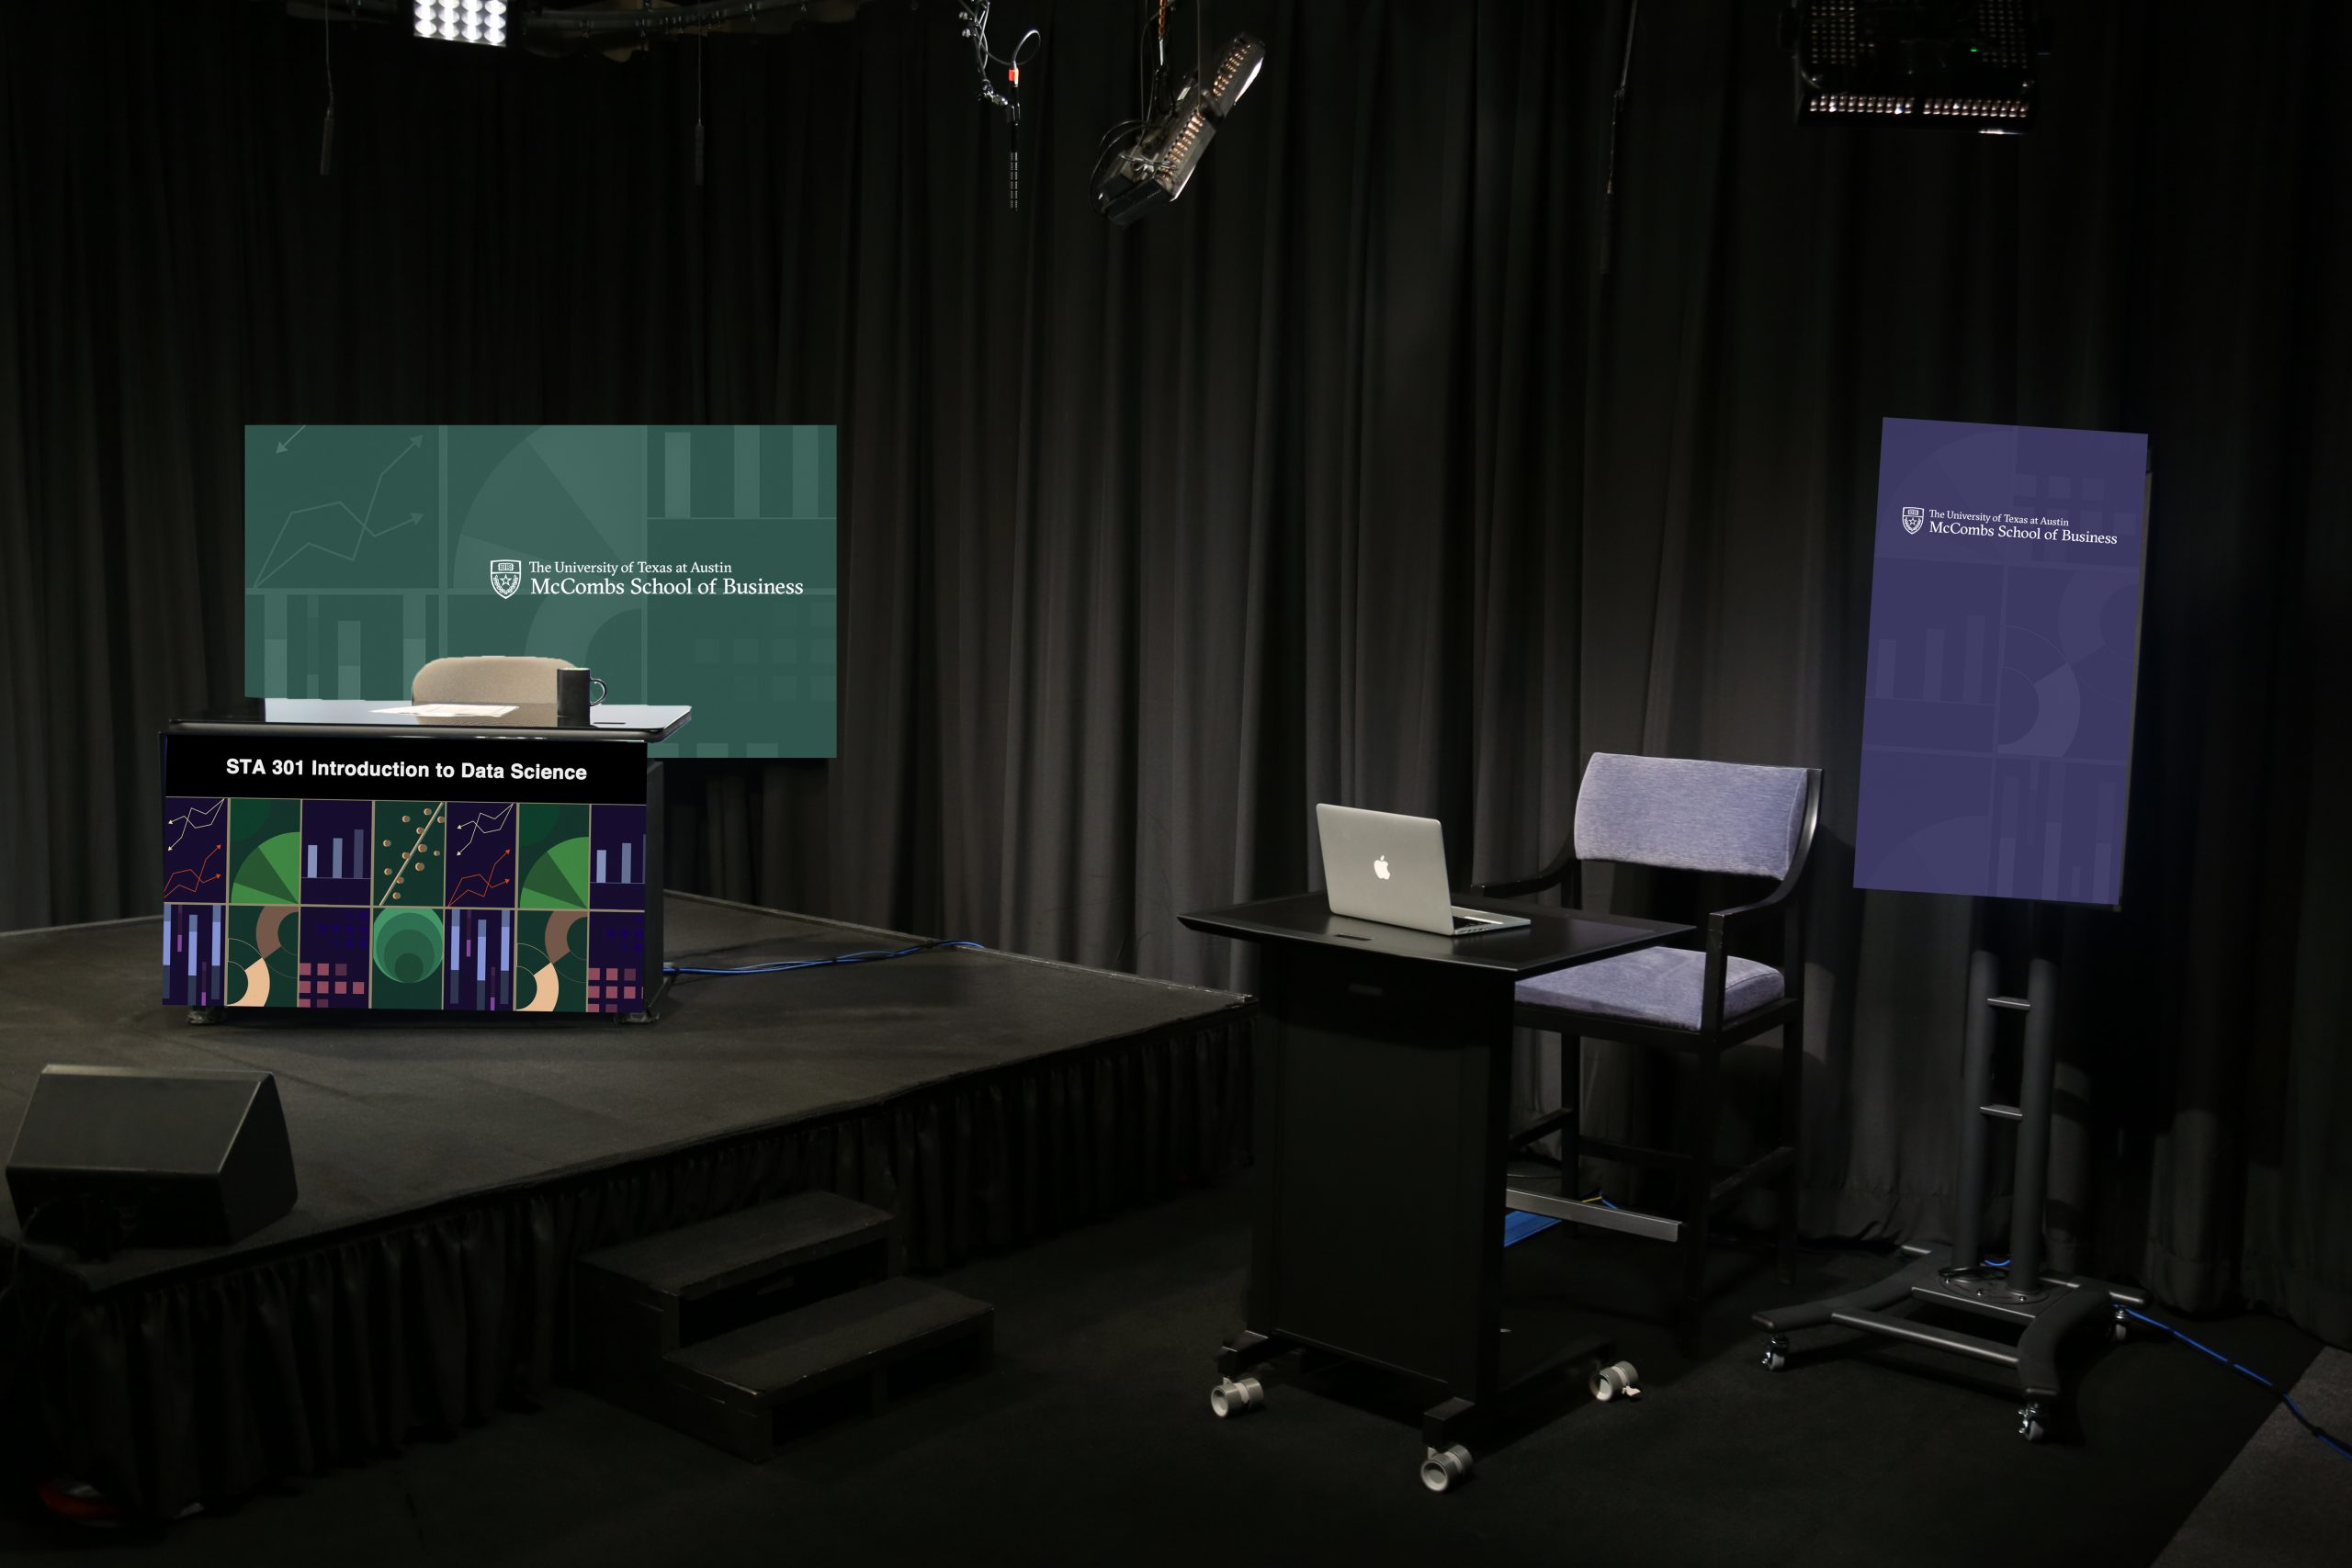
Studio set up:


