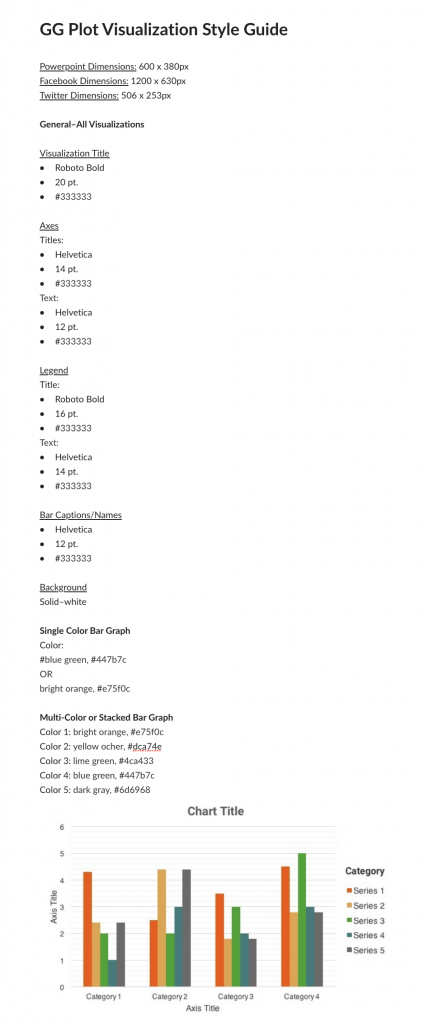
I started working on a visualization project for the Dev. Studio using GG Plot. Thus far, learning GG Plot has consisted of a lot of trial and error. First, I developed a style guide outlining font families, font sizes, font faces, text color, background color, and bar colors.
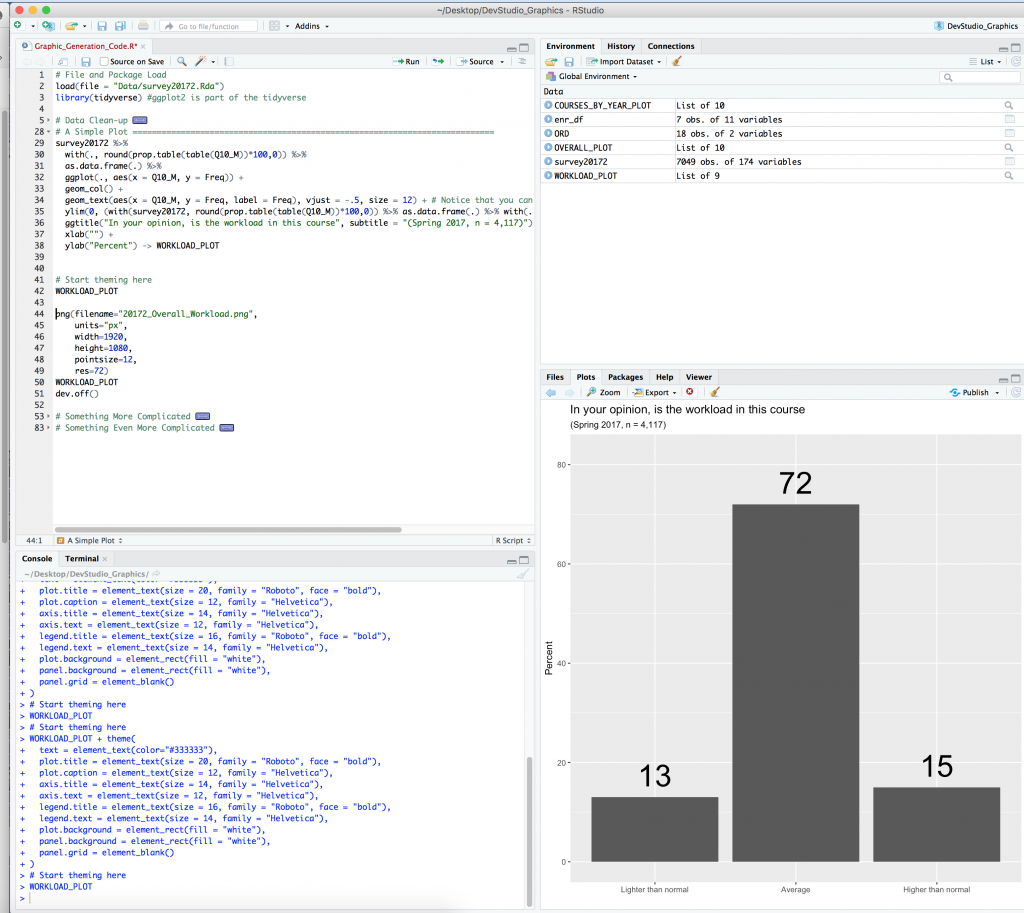
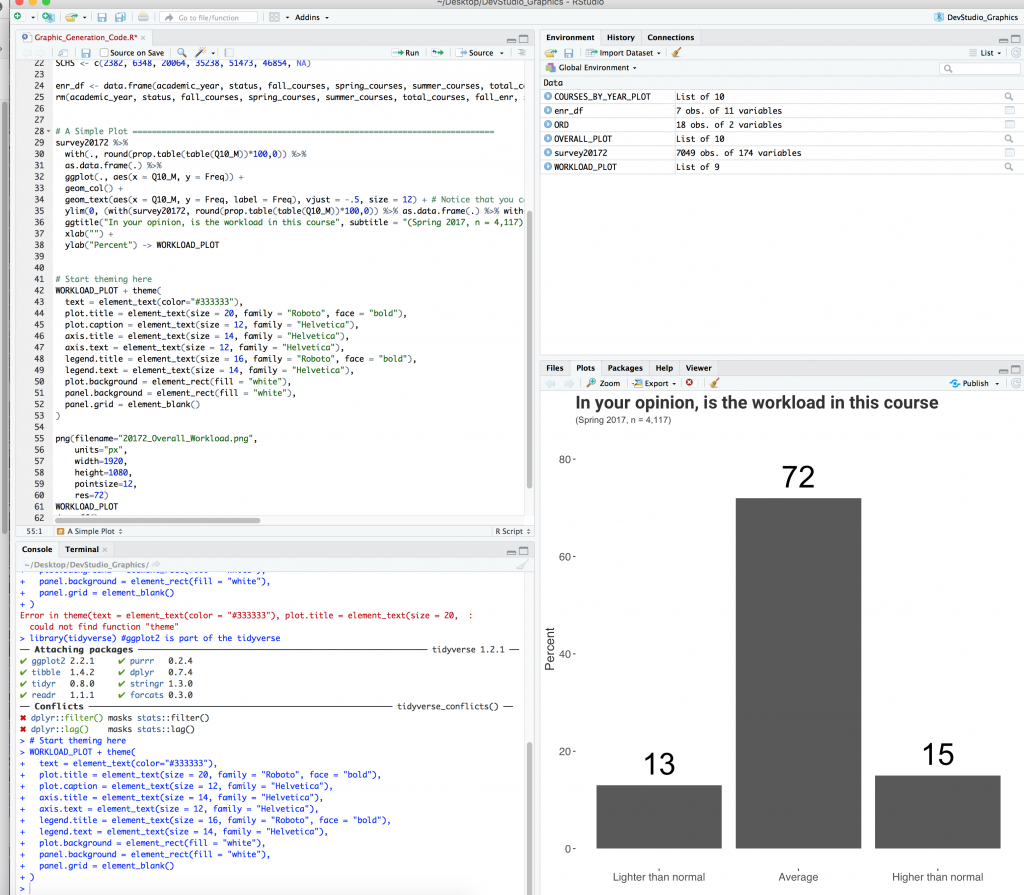
For one visualization, I have successfully changes the fonts and background to match the style guide using this block of code (which can then be copy+pasted to make any visualization adhere to this font and bg style):
Original:
Updated:


